Under Construction
The financial wing of mathestate is fully operational, but as it grows or is modified, this under construction file will show up as a place holder for web pages to soon to come.
Predicting the next crash. Volatility and market price trends are closely related. The TrackVolatility page is following the daily pattern of market volatility to determine an exit point.
For more information contact: Bob Rimmer.

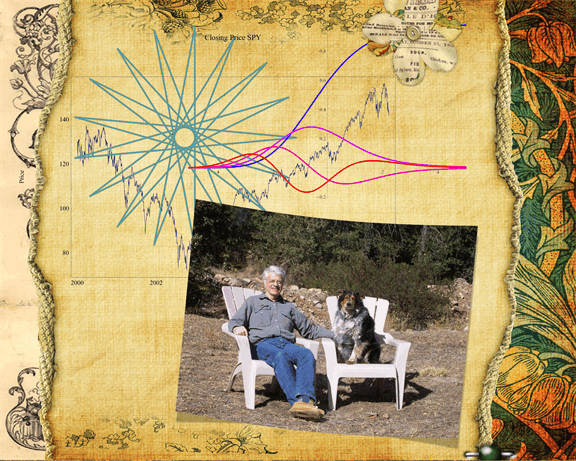
The graphic was designed by Beth Rimmer. The heptadecagon star reminds us of Gauss, who proved that this geometric figure could be constructed with a ruler and a compass. He also brought us analysis of observational errors using the Gaussian or normal distribution, which is the pinnacle of stable distributions. The smooth curves are a stable {1.7, 1, 1, 0} distribution function and its first three derivatives. Stable distributions are infinitely differentiable. The stock price graph is of the SPY ETF, which is used in many of the examples.

© Copyright 2009 mathestate Sun 30 Aug 2009
