Volatility Tracking
Volatility can be thought of as an inverse function of liquidity. While liquidity is quantitatively vague, volatility is not. It can be measured as the scale factor of the distribution of market returns. Volatility is traditionally measured by taking standard deviation of a series of logarithmic returns. Implicit in such a measure is that the variance of the distribution is finite. Such an assumption may not be correct for financial markets so we present methods of measuring the scale factor which will work if the variance of a distribution is infinite.
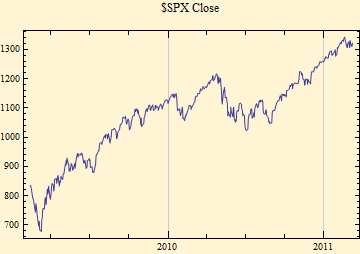
Below is the plot of the SPX (the S&P 500 index as calculated by the CME Group). The plot below shows the closing prices since mid-February 2009, capturing the market bottom in March 2009.
For our analysis we will scale each day's one minute logarithmic return data. In the plot below two different methods are used. In red is a method based on the empirical characteristic function, the unit scale factor is chosen to be identical to that of a stable distribution. The calculation is made at the one point on the empirical characteristic function that would be independent of stable distributional shape parameter, α. The method is otherwise distributionally independent. In green is a calculation made by L-moments. The assumption with this method is that the expectation of the distribution is finite. To be on the same scale with the other fits this calculation is adjusted by a factor chosen to make it parallel to the stable distribution fit. Each of these methods is completely independent of one another, but the L-moment method would have slightly less amplitude than the others if it were not rescaled.
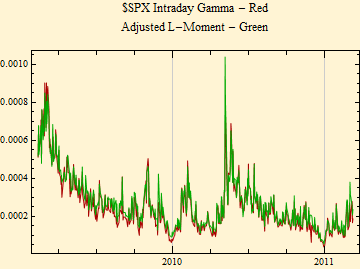
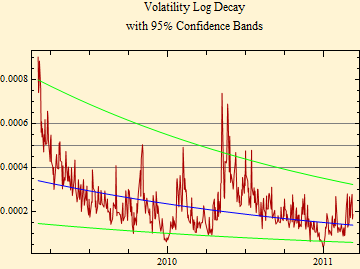
The highest amplitude of volatility coincided with the market bottom, perhaps slightly preceding it. We plan to track this volatility decay. Our expectation was that volatility will slowly fall until some event drives it up again. Now that the tracking has been followed for more than 1.5 years, we have seen some more recent spikes, most notably with the Greek debt crisis in May 2010. Volatility typically increases during the quarterly reporting seasons. The plot below shows the decay since the recent peak in volatility along with a logarithmic decay model and the model 95% confidence bands in green.
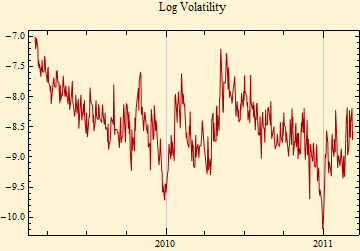
A plot of log volatility below shows that the decay of a volatility spike over time is somewhat linear. This is particularly true for the spike peaking in March of 2009 and the more recent spike in May 2010 associated with the Greek debt crisis. Both these decays show a similar slope, suggesting a similar exponential decay process to volatility after a spike.
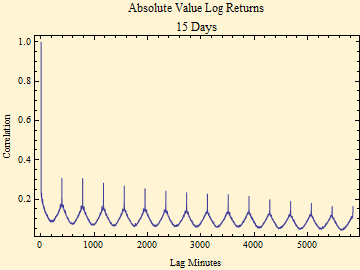
Keep in mind that the calculations above are sort of an average volatility for the day. In fact the volatility varies throughout the day. The autocorrelation plot below of absolute value of log returns picks up the daily cycle which is consistent with higher volatility at the market open and close and the lowest volatility occuring at mid day.
Intra-day samples of several hours may also be evaluated by the methods above.
We have developed a simpler measure of volatility that can track the same information from intra-day high and low prices: HighLowVolatility.
The intraday data source for this page has become unreliable; a ![]() page has been set up to monitor volatility based on daily data.
page has been set up to monitor volatility based on daily data.

© Copyright 2011 mathestate Sat 12 Mar 2011
