Properties of the Log Normally Scaled Stable Distribution
On the previous page, we showed that the lognormally scaled stable (LNS) distribution could be simulated with the product of a standardized stable random variable and a lognormal random variable. The LNS distribution is more properly thought of as a mixture distribution (Feller, Vol. 2, p. 53) with the scale parameter, γ, having a lognormal distribution. It can be calculated as follows.
Let λ (x, μ, σ) be the lognormal density function.

Where SCDF(x, α, β, γ, δ) is the stable distribution function, the distribution function of our LNS mixture distribution becomes:
![]()
Likewise the LNS density is shown below, where SPDF(x, α, β, γ, δ) is the stable density function.
![]()
Note that we have replaced μ with log(γ); as such, γ becomes the median of the lognormally distributed set of ![]() random variables, and it is estimated as the geometric mean of that sample. The LNS distribution and density functions are degenerate at σ = 0, and we can define them as the SCDF(x, α, β, γ, δ) and SPDF(x, α, β, γ, δ) functions at this parameter point.
random variables, and it is estimated as the geometric mean of that sample. The LNS distribution and density functions are degenerate at σ = 0, and we can define them as the SCDF(x, α, β, γ, δ) and SPDF(x, α, β, γ, δ) functions at this parameter point.
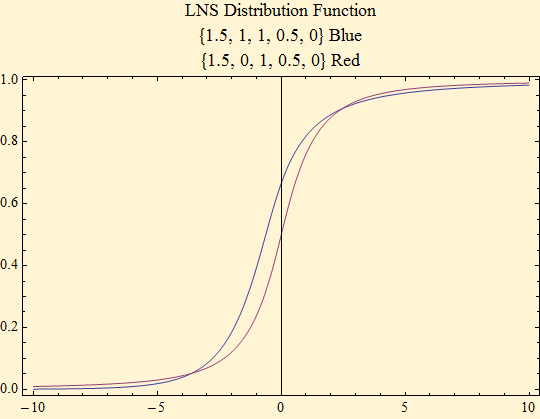
Plots of the distribution function with parameters, {α, β, γ, σ, δ}.
Plots of the LNS and stable density functions with the same parameters, {α, β, γ, (σ), δ}. The stable functions are in the brighter colors.
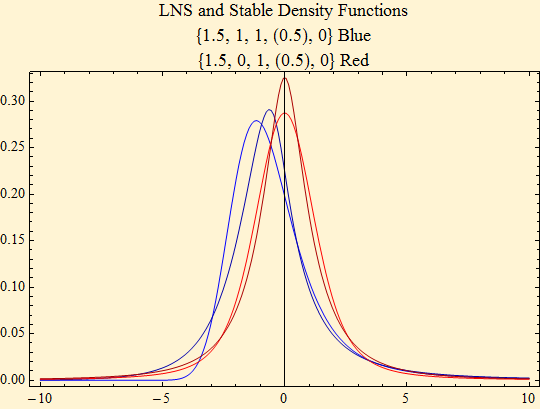
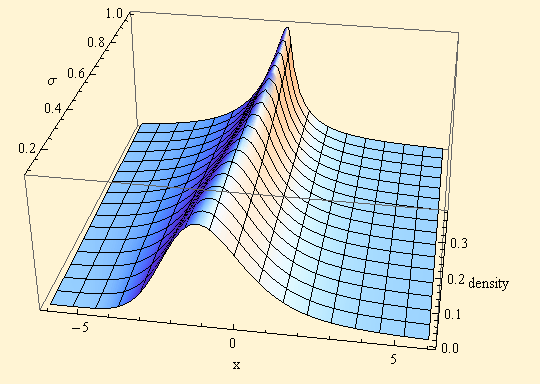
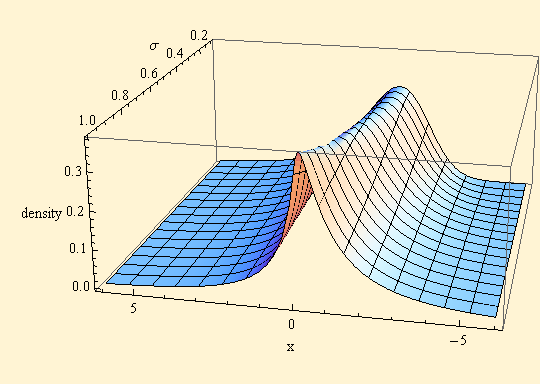
Note that the LNS distribution effectively has another shape parameter, σ, which squeezes the distribution in the middle and creates a taller mode. The symmetric distribution has the taller mode than the skewed distribution in both cases. A three dimensional plot below shows this concept better, and further shows that the skewness is modified as σ increases. From the change of shape, as σ increases, it appears that σ will likely be less than 1 for most financial distributions.
The tail behavior of the stable and LNS distributions eventually becomes the same as x increases, but the linearity on the log-log plot arises more slowly in the LNS distribution. The right side of density plots are shown. The next three plots show the effect of increasing σ. As σ increases, it takes longer for the log-log linear phase of tail behavior to take hold.
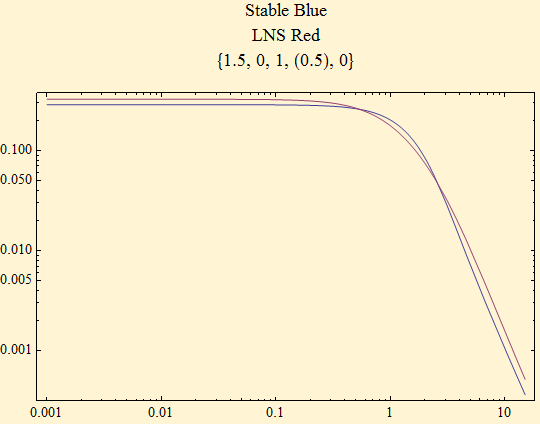
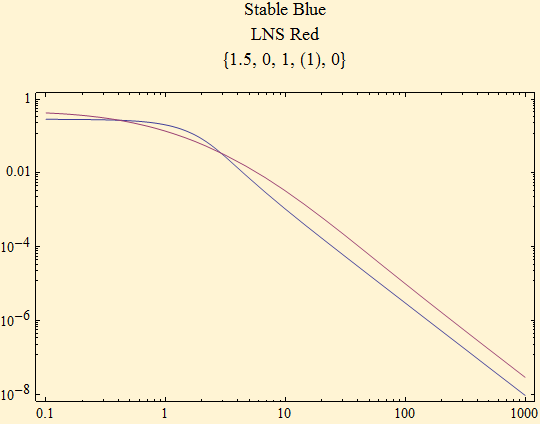
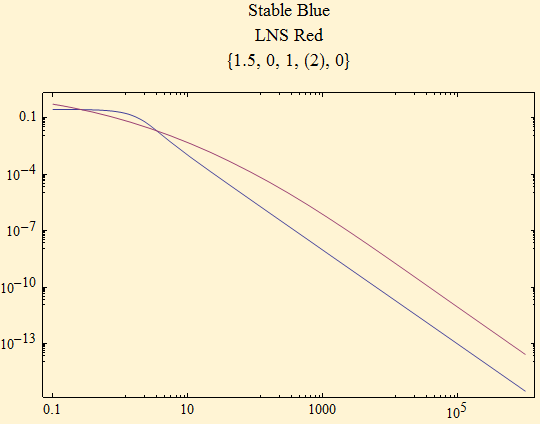
Here is the heavy tail of the maximally skewed density for the same α, 1.5.
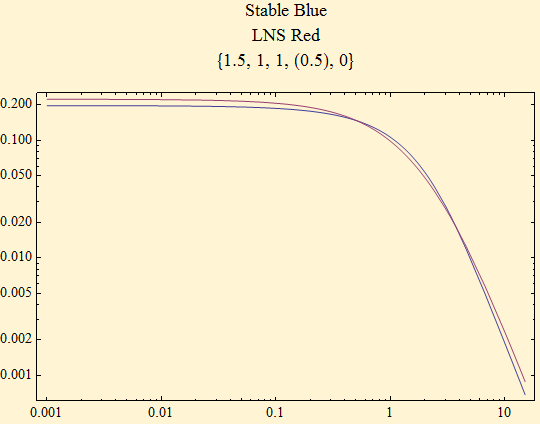
The light tail of the maximally skewed density shows similar behavior to the stable, but does not decay so rapidly.
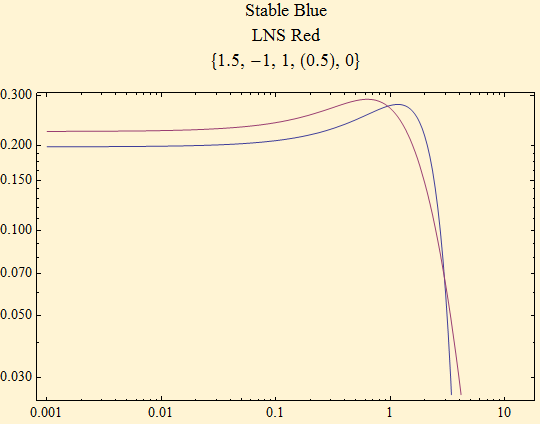
We conclude that the tail behavior of the LNS distribution eventually approaches the tail behavior of the stable distribution. Thus sums of LNS random variables should eventually have a limiting distribution that is a pure stable distribution by the generalized central limit theorem, but this might take sums large numbers of random variables.
In summary, the LNS distribution has another shape parameter, σ, that squeezes the middle of the distribution, causing a higher peak to the mode, and delays the stable tail behavior which occurs further from the mode of the distribution. Ultimately the distribution is heavy-tailed with the same tail exponent as the stable distribution from which it is derived.

© Copyright 2009 mathestate Sat 17 Jan 2009
