Stable Stock Analyzer
Initialization procedures below this cell
Enter the stock mutual fund or index symbol and the start date. The program will collect all the data from the Wolfram webserver between the start date and present. Change the inputs in the cell below, select all the cells in the notebook, and evaluate.
The calculations use a stationary stable strategy, but one of the graphs collects a picture of stable gamma over the previous month. Projected probabilities will be dependent on the assumptions about gamma and the calculations of alpha which for a stationary model tend to underestimate the value of alpha--see the graph of the fit at the tails. If you use the calculations for price projections, you must be wary of the errors introduced by a model that is not a fully accurate representation of market behavior. The program is designed so that market price behavior may be explored; the outputs are not guaranteed to be accurate. The user must assume all risk for his own interaction with these data.
![]()
Get data from web server
![]()
![]()
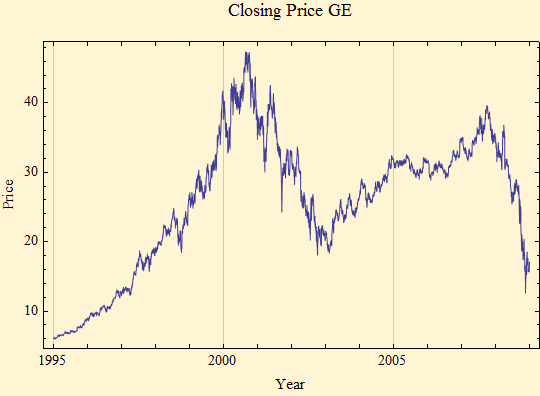
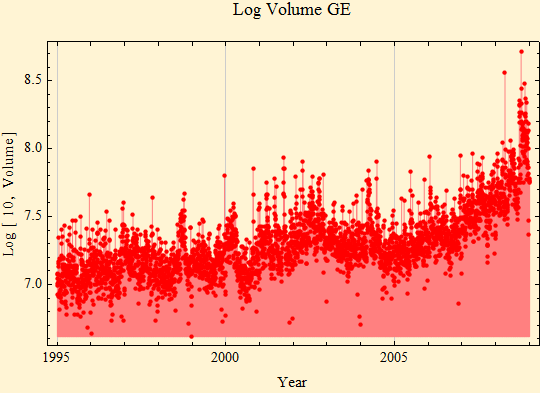
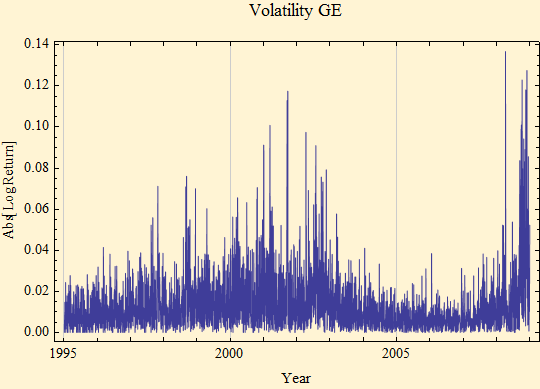
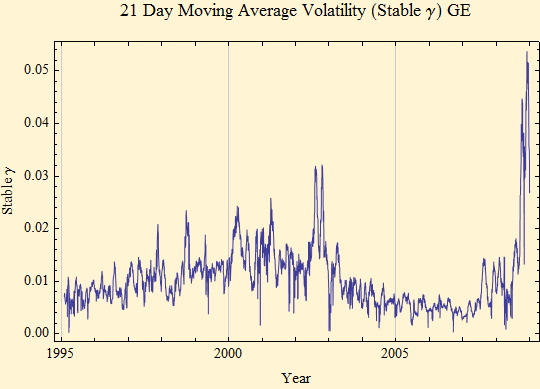
![]()
| α | β | γ | δ | |
| Day Open Data | 1.58666 | 0.0269509 | 0.00981359 | 0.000434506 |
| Day High Data | 1.54144 | 0.021353 | 0.00770114 | 0.000359948 |
| Day Low Data | 1.49604 | -0.0383448 | 0.00826313 | 0.000361279 |
| Day Close Data | 1.64544 | 0.0454057 | 0.0100257 | 0.000494507 |
| Week Close | 1.70522 | 0.00307412 | 0.0216048 | 0.00165165 |
| Scaled Week from Day | 1.64544 | 0.0454057 | 0.0266628 | 0.00247253 |
| Scaled Month from Day | 1.64544 | 0.0454057 | 0.0637793 | 0.0103846 |
Stable fit shown in Log-Log format for close data.
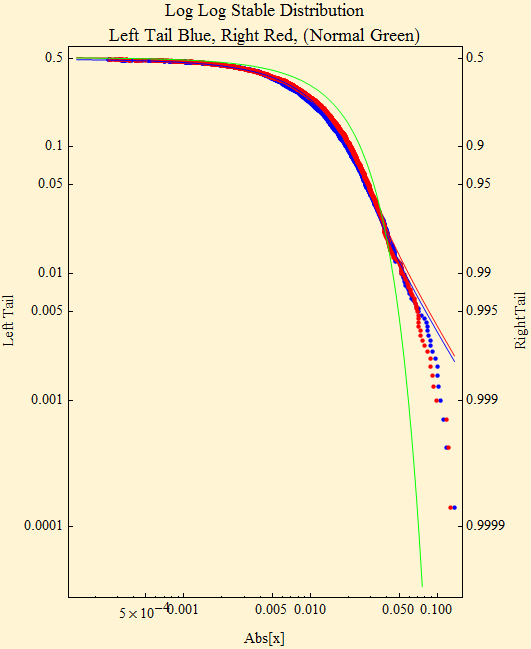
Slide mouse over the graph below to calculate the probability at a given price.

![]()
| Probability of Lower Return |
Percent Return |
Probability of Higher Return |
| 0.05 | -15. | 0.95 |
| 0.1 | -10.8 | 0.9 |
| 0.15 | -8.4 | 0.85 |
| 0.2 | -6.6 | 0.8 |
| 0.25 | -5.1 | 0.75 |
| 0.3 | -3.7 | 0.7 |
| 0.35 | -2.5 | 0.65 |
| 0.4 | -1.3 | 0.6 |
| 0.45 | -0.2 | 0.55 |
| 0.5 | 0.9 | 0.5 |
| 0.55 | 2.1 | 0.45 |
| 0.6 | 3.2 | 0.4 |
| 0.65 | 4.5 | 0.35 |
| 0.7 | 5.8 | 0.3 |
| 0.75 | 7.4 | 0.25 |
| 0.8 | 9.1 | 0.2 |
| 0.85 | 11.3 | 0.15 |
| 0.9 | 14.5 | 0.1 |
| 0.95 | 20.4 | 0.05 |
![]()
| Date | Dividend |
| Mar 01 1995 | 0.06833 |
| Jun 30 1995 | 0.06833 |
| Sep 27 1995 | 0.06833 |
| Dec 27 1995 | 0.07667 |
| Mar 04 1996 | 0.07667 |
| Jul 01 1996 | 0.07667 |
| Sep 26 1996 | 0.07667 |
| Dec 27 1996 | 0.08667 |
| Mar 04 1997 | 0.08667 |
| Jul 02 1997 | 0.08667 |
| Sep 26 1997 | 0.08667 |
| Dec 29 1997 | 0.1 |
| Mar 05 1998 | 0.1 |
| Jul 06 1998 | 0.1 |
| Sep 28 1998 | 0.1 |
| Dec 29 1998 | 0.11667 |
| Mar 04 1999 | 0.11667 |
| Jul 06 1999 | 0.11667 |
| Sep 28 1999 | 0.11667 |
| Dec 22 1999 | 0.13667 |
| Mar 06 2000 | 0.13667 |
| Jul 05 2000 | 0.137 |
| Sep 29 2000 | 0.137 |
| Dec 27 2000 | 0.16 |
| Mar 05 2001 | 0.16 |
| Jul 05 2001 | 0.16 |
| Sep 26 2001 | 0.16 |
| Dec 27 2001 | 0.18 |
| Feb 27 2002 | 0.18 |
| Jun 26 2002 | 0.18 |
| Sep 25 2002 | 0.18 |
| Dec 27 2002 | 0.19 |
| Feb 26 2003 | 0.19 |
| Jun 26 2003 | 0.19 |
| Sep 25 2003 | 0.19 |
| Dec 29 2003 | 0.2 |
| Feb 26 2004 | 0.2 |
| Jun 24 2004 | 0.2 |
| Sep 23 2004 | 0.2 |
| Dec 22 2004 | 0.22 |
| Feb 24 2005 | 0.22 |
| Jun 23 2005 | 0.22 |
| Sep 22 2005 | 0.22 |
| Dec 22 2005 | 0.25 |
| Feb 23 2006 | 0.25 |
| Jun 22 2006 | 0.25 |
| Sep 21 2006 | 0.25 |
| Dec 21 2006 | 0.28 |
| Feb 22 2007 | 0.28 |
| Jun 21 2007 | 0.28 |
| Sep 20 2007 | 0.28 |
| Dec 20 2007 | 0.31 |
| Feb 21 2008 | 0.31 |
| Jun 19 2008 | 0.31 |
| Sep 18 2008 | 0.31 |
| Dec 24 2008 | 0.31 |
![]()
| 0.05 | 0.10 | 0.20 | 0.25 | 0.30 | 0.40 | |
| Last Low | 13.83 | 14.51 | 15.2 | 15.44 | 15.66 | 16.05 |
| Last Close | 14.51 | 15.22 | 15.95 | 16.2 | 16.43 | 16.84 |
![]()
![]()

| 0.05 | 0.10 | 0.20 | 0.25 | 0.30 | 0.40 | |
| Last High | 20.55 | 19.54 | 18.63 | 18.33 | 18.07 | 17.62 |
| Last Close | 20.55 | 19.54 | 18.63 | 18.33 | 18.07 | 17.62 |
![]()
![]()

© Copyright 2009 mathestate Sun 4 Jan 2009
