Sums of Stable Random Variables
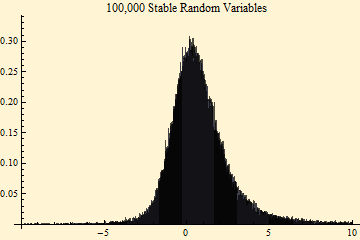
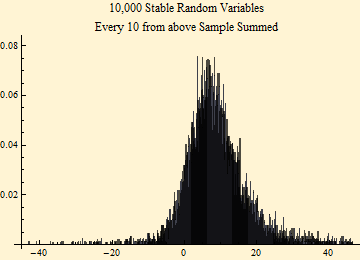
Below we show the histogram of 100,000 stable variables generated for parameters {α, β, γ, δ} = {1.5, 0.6, 1, 1}. We then took the sample, partitioned it into groups of 10 random variables. Each of the groups was summed and the second histogram shows the distribution of the sums of 10 random variables. Note that the shape is the same, but that the scale and location have changed.


The parameter fits to each sample are shown below.
| α | β | γ | δ | |
| 100,000 RVs | 1.49917 | 0.614881 | 1.00149 | 1.01061 |
| 10,000 RVs | 1.50205 | 0.600709 | 4.65293 | 10.082 |
For the 1-parameterization of stable distributions which we are using we would expect γ and δ to change by the following relationships. The expected ![]() and
and ![]() are calculated from the parameters from the fit to 100,000 RVs.
are calculated from the parameters from the fit to 100,000 RVs.
![]()
![]()

© Copyright 2008 mathestate Fri 19 Dec 2008
