Stable Probability
The integral of a statistical probability density is equal to one. The stable probability or distribution function can be calculated by integrating the density with respect to x. Fortunately the integration of the Fourier integrand with respect to the density function variable has a closed form so only one numerical integration is needed. For stable distributions, the numerical integration yield the probability is actually simpler than that for the density.
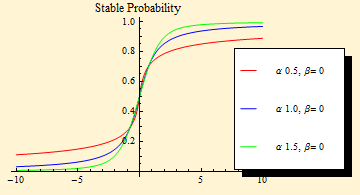
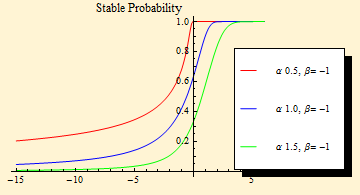
The two plots below show the probability distribution curves for symmetric and maximally left skewed stable functions.


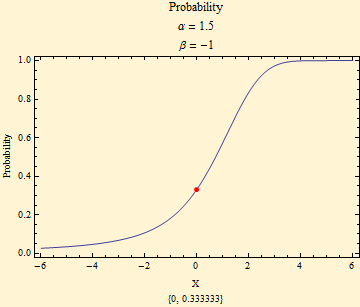
The graph below shows in greater detail the maximally left skewed probability for α = 1.5. The red dot is at x = 0; the brackets below the graph show the values of {x, probability}. At x = 0 one third of the probability is for x < 0, while 2/3 of the probability is for x > 0. In the notebook, this is a dynamic graph and the dot will move along the curve as the mouse pointer is placed in the graphic.

If we want to know the probability of an event between two points on the x axis, this probability is simply the difference of the probabilities at each point.
A link to interactive stable distribution calculations.

© Copyright 2010 mathestate Wed 24 Mar 2010
