Oil
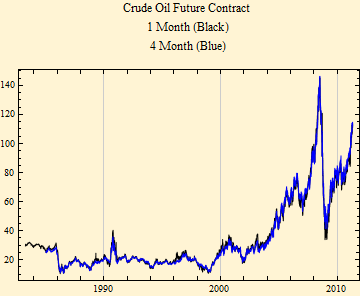
The price series are for Nymex one and four month forward contracts; they are obtained from the Energy Information Administration, by directly downloading a file that is updated weekly. The file has many other price series for energy related futures.
One month contract from Mon 4 Apr 1983 through Tue 3 May 2011.
Four month contract from Wed 2 Jan 1985 through Tue 3 May 2011.
The stable fits to the log returns.
| α | β | γ | δ | |
| One Month | 1.62099 | -0.0882347 | 0.0124742 | 0.0000711867 |
| Four Month | 1.67339 | -0.0994211 | 0.0107453 | 0.000162809 |
The graph of the fits shows that oil futures just like stock prices have tails that are too light. One month contract on top, four month on the bottom.
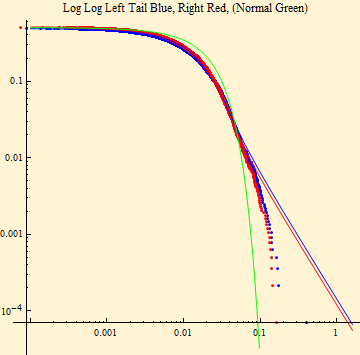
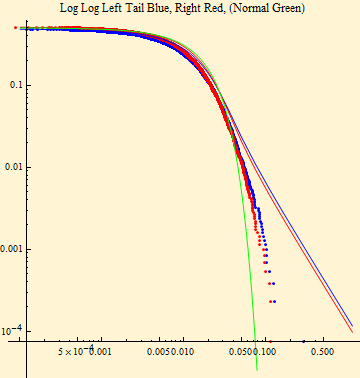
Like stock prices, the oil futures prices can also be fit to the lognormally scaled normal distribution.
| γ | σ | δ | |
| 1 Month | 0.0126344 | 0.533841 | 0.00018853 |
| 4 Month | 0.0108422 | 0.473907 | 0.000223262 |
The fits below show the fit to the lognormally scaled normal distribution. Just as with stock prices, long time-series of oil futures seem to have a better fit to this distribution.
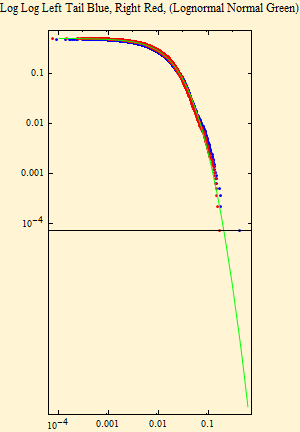
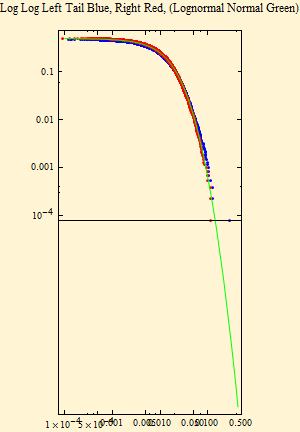
This note book shows that energy futures prices have the same behavior as stock prices. They are unfortunately difficult to study because the contracts are continually expiring. In this case we use a file that is updated weekly and adjusts for the expirations.

© Copyright 2011 mathestate Sat 7 May 2011
