Distributions of Returns
We have seen how to calculate returns over some period of time using log prices; but have we have also seen that this approach does not give a very complete description of market behavior. From now on we will look at log returns or the sequential differences of log prices. We go back to the whole daily time series.
Start ... Friday 29 January 1993
End ... Friday 26 March 2010

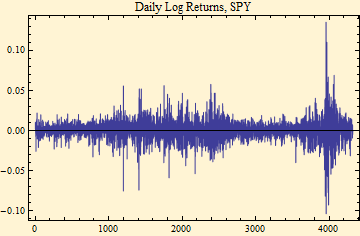
We now have a very different picture of what is going on. There are periods of quiet and periods of wild variation in daily returns.
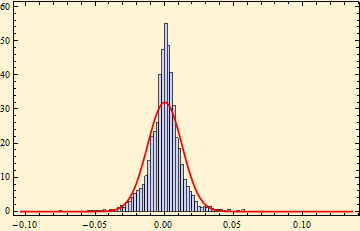
The density histogram of this series of log returns show that it has a tall peak and heavy tails. We show the fit to a Normal distribution to this and then ask you to forget about Normal distributions for financial data forever. The fit is not good, but the real problem is that, events in the tails are greatly underestimated with the Normal assumption.

Below are the three best and the three worst log returns in series.
{0.0693195, 0.110508, 0.135598}
{-0.10364, -0.0926688, -0.0815945}
Here are the probabilities of the respective occurrences of events better or worse than each of these events as calculated with a Normal distribution.
{0.0000000159184288, 0., 0.}
{0.00000000000000004096464061, 0.00000000000004692933512, 0.00000000002656838154}
Taking the reciprocals of the probabilities we see how often in trading days we should expect these occurrences along with the length of the time-series at the bottom.
{62820270, ComplexInfinity, ComplexInfinity}
{24411296793551652, 21308633447365, 37638724759}
4322
The same results expressed in years; yet over and over we read in the news about how these events should only occur in millions of years--try billions, trillions or even infinity! Financial returns are not Normally distributed! We believe that the stable distributions offer a better alternative.
{249,286.79, ComplexInfinity, ComplexInfinity}
{96,870,225,370,000., 84,558,069,240., 149,360,018.9}
17.15

© Copyright 2010 mathestate Fri 26 Mar 2010
