Market Returns
So far we have been assuming that time is continuous. Such an assumption creates a bit of a problem with financial returns. Markets are not always open. When they are closed, you usually will have a difficult problem if you need to liquidate a security. The same problem will occur if you have a savings account and the bank is closed on the day you want the money. If you need it immediately, you cannot get it; you will have to make some kind of other arrangement for cash. In this sense, when markets are closed, there is no time. We have chosen this assumption when dealing with market returns, because it will make statistical analysis easier later; eventually electronic markets are likely to be open most of the time so this difficulty may disappear. The problem is that if the market is closed for a long period of time, say a three day weekend, something might happen that reduces the value of an equity, but since you cannot liquidate it anyway you are stuck. It is easier to allow this extra time related risk to accumulate in the following interval. When we deal with stock market returns, we will generally consider daily returns, converting them to annual returns by multiplying by the number of trading days in a year, usually currently 250 to 252. Delayed historical daily data is now readily available from sources like Google and Yahoo at no cost. It is also built into Mathematica.
Let's look at some actual financial data, we will frequently use the S&P 500, "SPYders," ticker symbol, SPY, in this and other examples. Since it is comprised of a weighted average of 500 stocks, it will not have so much volatility as a single stock, but it gives a good idea of what to expect from the market in general or a diversified mutual fund.
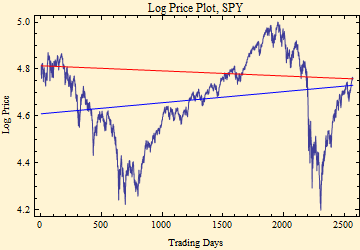
Start ... Monday 3 January 2000
End ... Friday 26 March 2010
The data is taken from the above time frame. The plot shows the log price versus equally spaced trading days. The red fit is obtained from the mean return (a line between the first and last prices) and the blue fit is a least squares regression. The calculated annual returns are shown below the graph. The time frame was purposely chosen to be rather linear, and covers a period of relatively quiet market volatility, next we will look at a longer time frame.

Annualized Mean Return -0.0054443
Least Squares Fit Return 0.0119703
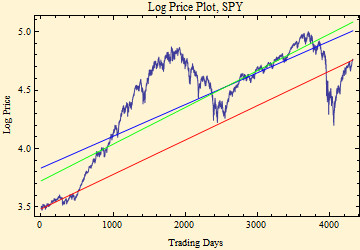
We take the starting point of trading of the "SPYders" in 1993. This longer time frame shows more of the difficulties of trying to fit a long market time series. The mean fit is again in red and the least squares regression is in blue, another fit is added, performed by minimizing the sum of absolute deviations rather than the squares of the deviations. Least squares regression works best if deviations (residuals) are Normally distributed. This is not the case with financial data. By squaring the deviations, large deviations are over weighted. Using the absolute deviation eliminates some of the problem. You can now see that the fitted returns (slopes) are now quite different. If you had bought at the beginning and held on until the end, you would have experienced something like the red line on average, but you would have experienced an exhilarating rise followed by a crash then another less dramatic rise.
Start ... Friday 29 January 1993
End ... Friday 26 March 2010

Annualized Mean Return 0.0771075
Least Squares Fit Return 0.0708376
Absolute Deviation Fit Return 0.0824648
A quick note. The data used in the above sets are "adjusted prices." This means that dividends paid are subtracted from previous prices. Thus the returns calculated above include the dividends, assuming that you reinvested them at about the time they were received and paid no commissions.
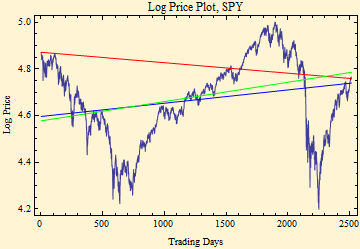
The above graph shows that there is a lot lost if only some kind of average returns are considered; further it is not really clear how to calculate the averages. The return data give little information about the risk of holding a security, and the returns if we started the series at a market peak, look very different.
Start ... Friday 24 March 2000
End ... Friday 26 March 2010
If you bought at the market peak in 2000, the red line mean return shows your net experience; the other fits will not make you feel any better.

Annualized Mean Return -0.0112232
Least Squares Fit Return 0.0144322
Absolute Deviation Fit Return 0.0210705

© Copyright 2010 mathestate Fri 26 Mar 2010
