Stable Approximation with FFT
We showed in the page on differentiation with the FFT that is was a simple matter to calculate the serial derivatives of a function in the Fourier domain. Here we use that information to enhance the accuracy of an interpolated routine. The interpolation function in Mathematica allows the addition of derivatives of the function; the addition will improve the accuracy of the function. The StableM package uses the FFT of the characteristic function with the interpolation function to create a stable density approximation for maximum likelihood fitting, but the approximation does not take full advantage of the interpolation as a compromise for speed. Below a stable characteristic function {1.5, 1, 1, 0} is sampled to create the density and its first two derivatives.
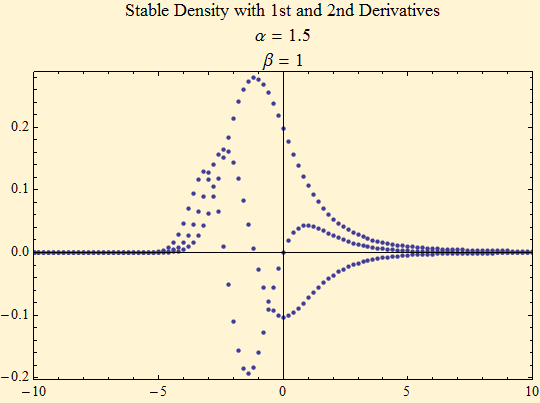
Below is a graph created from all of that information.
grid = Transpose[{{#} & /@ XTable[sr, nn], ReOrder[dens], ReOrder[dens1], ReOrder[dens2]}];
f = Interpolation[grid];
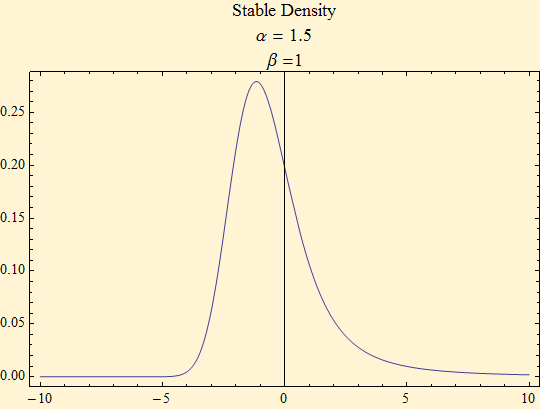
Plot[f[x], {x, -10, 10}, PlotRange -> All, PlotLabel -> "Stable Density\nα = 1.5\nβ =1", Frame -> True]
The plot below shows the difference between the Zolotarev integral calculation and the third order interpolated function with and without the use of the first two derivatives. The interpolated function with the derivatives is more accurate.
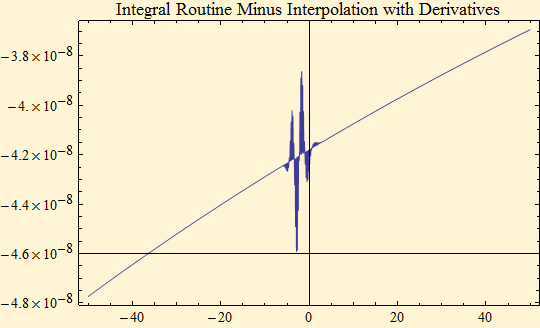
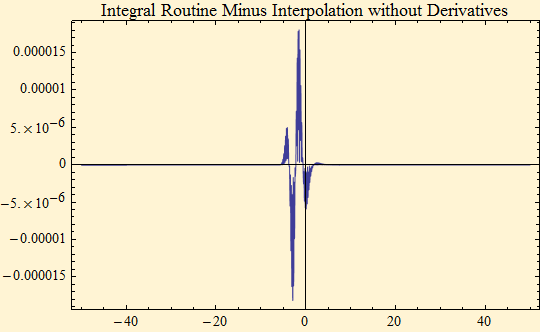
It can be seen from the first of the above graphs that the interpolated function over estimates the density. This is because the mean of the Fourier transform was set to 1, the value of the characteristic function at t = 0. However, our sample does not run from (-∞, ∞), but rather on the interval below. We have calculated the value of the integral over that range.
f[[1]][[1]]
mass = Quiet[SCDF[-f[[1]][[1]][[1]], {1.5, 1}] - SCDF[f[[1]][[1]][[1]], {1.5, 1}]]
![]()
![]()
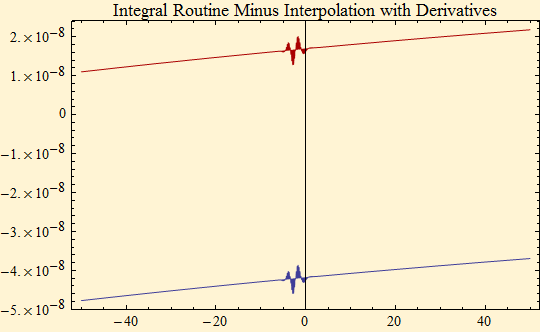
Below is a new graph changing the first term of our sampled characteristic function in the Fourier domain to that reflect mass. We have brought the difference closer to zero, but now are underestimating the density slightly.

© Copyright 2008 mathestate Sat 8 Mar 2008
