Differentiation and Integration
Differentiation in the transform domain can be done with multiplication of each term by -i t.
differentiate = Compile[{t} , -I t];
scale = 8192/16;
sdft = DFTCF[CF1c[#1, 1.5, 0.5, 1, 0] &, 16, 8192];
df = scale DFTCF[differentiate[#1] &, 16, 8192];(*this isn't scaled so it is multiplied by scale*)
conv = Chop[InverseFourier[sdft df]];
g1 = ListPlot[Transpose[{XTable[16, 8192], ReOrder[conv]}], PlotRange -> {{-20, 20}, All}, Joined -> True, PlotStyle -> Blue]
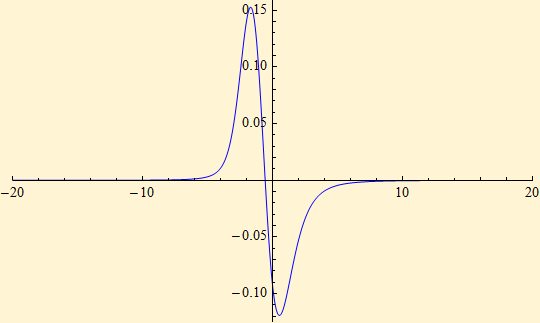
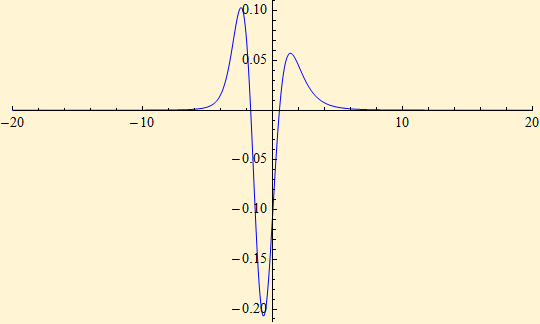
Differentiate twice
conv = Chop[InverseFourier[ sdft df df]];
g1 = ListPlot[Transpose[{XTable[16, 8192], ReOrder[conv]}], PlotRange -> {{-20, 20}, All}, Joined -> True, PlotStyle -> Blue]
The following creates a distribution function. This is also multipication operation for each term but the first element must be replaced with π. The constant of integration has to be added; in this case it is 1/2.
integrate = Compile[{t} , If[t == 0, Pi, -1/(I t)]];
scale = 8192/16;
int = scale DFTCF[integrate[#1] &, 16, 8192];
conv = Chop[InverseFourier[int sdft]];
g1 = ListPlot[Transpose[{XTable[16, 8192], ReOrder[conv] + 1/2}], PlotRange -> {{-20, 20}, All}, Joined -> True, PlotStyle -> Blue]
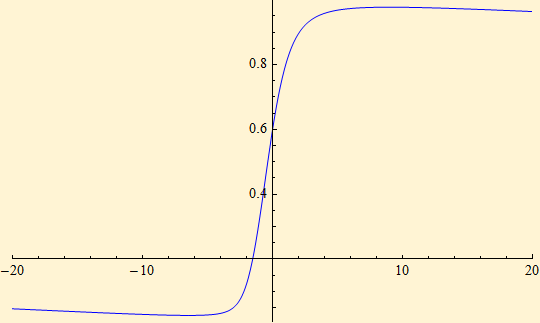
Clearly this is not correct. The FFT is expecting a periodic function that begins and ends at the same point. So here is a trick, make it look like a periodic function: join the pdf with an inverted reverse of itself. Put it back in the Fourier domain, use double the integral routine, but for the display only use the left half of the result.
conv = Chop[InverseFourier[ sdft]];
sdft2 = Fourier[Join[ReOrder[conv], -Reverse[ReOrder[conv]]]];
int = 2 scale DFTCF[integrate[#1] &, 2 16, 2 8192];
conv = Chop[InverseFourier[int sdft2]];
g1 = ListPlot[Transpose[{XTable[16, 8192], Drop[conv, -8192] + 1/2}], PlotRange -> {{-20, 20}, All}, Joined -> True, PlotStyle -> Blue]
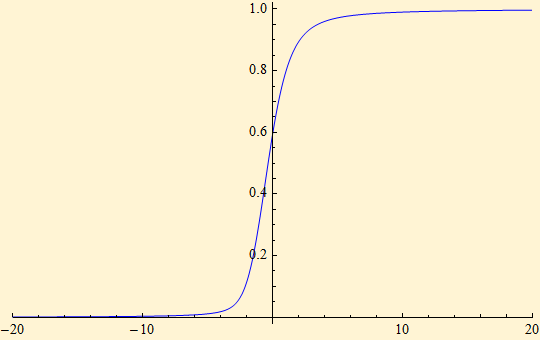
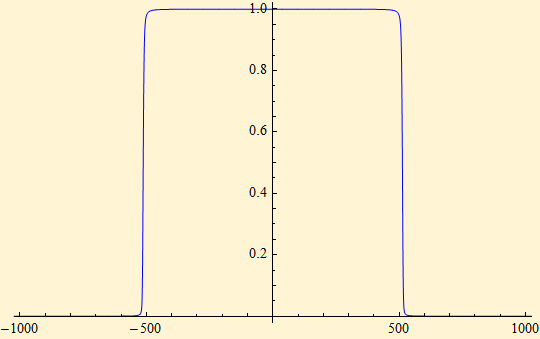
This is what both sides of it looks like.
g1 = ListPlot[Transpose[{XTable[2 4, 2 8192], conv + 1/2}], PlotRange -> {{-2 scale, 2 scale}, All}, Joined -> True, PlotStyle -> Blue]

© Copyright 2008 mathestate Fri 29 Feb 2008
