Tail Behavior
The object of this module is to demonstrate the spectrum of tail behavior for a wide range of statistical distributions and to show how tail behavior impacts sums of random variables as they converge to a stable domain of attraction by the generalized central limit theorem. In the demonstration we will focus on the right tail of the distribution function, by taking its complementary distribution function or survival function, where F(x) is the distribution function.
![]()
Everything in the discussion can also be applied to the left tail of the distribution function in the format, where the distribution function F(-x) is centered near zero so that the negative left tail is positive on a graph. This orientation is important since log log plots are essential to the visualization of the process so x must be positive. If a distribution has two tails then the heavier tail would dominate in the convergence of sums of random variables, in which case the heavier tail should be the one examined carefully.
![]()
First we will be interested in distributions which display power tail behavior as x grows large, such that
![]()
For such distributions, where E denotes Expectation,

Thus for α < 2, the variance of such distributions will be infinite, and convergence of sums of random variables will be to a stable distribution with a shape parameter α < 2. Distributions which display this tail behavior should have the following limit as x → ∞, where f(x) is the density function.
![]()
We will use two distributions which have this characteristic, the generalized extreme value distribution (GEV) and the generalized Pareto distribution (GPD).
GPD

GEV
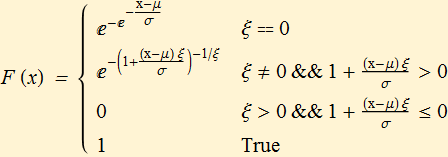
The distributions above have a shape parameter ξ, which for ξ > 0, the substitution ξ → 1/α, can be made to get the appropriate tail exponent α. This parameterization with ξ is used to make the distributions continuous at ξ = 0 at which point they display the lighter tail behavior of the exponential distribution, which has a lighter tail than any power tail.
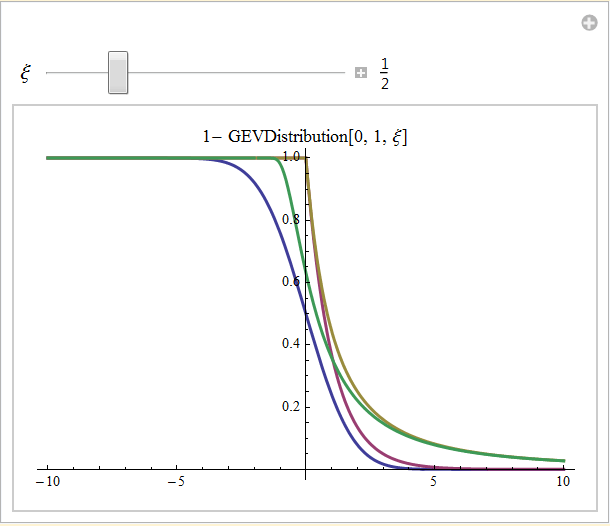
Now we are ready to look at some survival functions. In the graphic below there are the normal distribution in blue, the exponential distribution in red, the GPD in gold and the GEV in green; mousing over the curves will also identify the distribution. A slider is provided to change the shape parameter, ξ, of the GEV. The GPD is set with a tail parameter α = 2 or ξ = 1/2 for reference. The scaling is standardized so that the distributions should be similar in scale. The slider values for ξ have a range {-1/2, 4}, the 4, represents an α = 1/4 which is a very heavy tailed distribution. This graphic is mindless, its main purpose is to show that this format is not very good for looking at tail behavior, and to help you to appreciate what you will see in the following graphic which represents a log log plot of the same thing for values of x > 1.
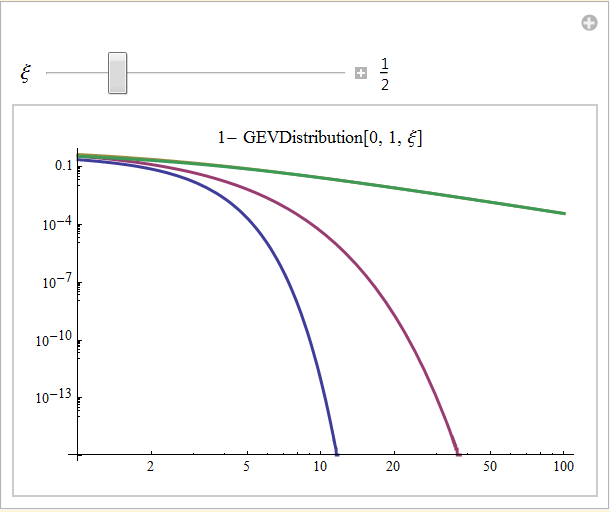
The graphic below shows the log log plot. The colors are the same, at the initial setting the GEV (green) is superimposed over the GPD (gold) as they both have the same tail exponent α = 2. The extreme values of this curve have a linear slope of -α = -2. Movement of the slider shows that the GEV can display the full spectrum of tail behavior, even lighter than the normal distribution. At ξ = 0, the GEV is superimposed over the exponential distribution (red). The exponential distribution, which has a tail lighter than that of any power law, can be thought of as the central distribution tail of the extreme value distributions. Clicking on the icon in the upper right corner will show a bookmark to quickly set ξ to zero. The power tail distributions such as the GPD can account for the entire spectrum of tail behavior heavier than the exponential. The gamma distributions will have tail behavior fitting into the gap between the exponential and the normal (blue), and the right tails of stable distributions with skewness parameter, β = -1 have a smooth progression of tails lighter than the normal down to α = 1, after which the right tail is finite. All distributions with negative tail slopes steeper (less horizontal) than the gold Pareto tail at α = 2, will have sums of random variables which converge to the domain of attraction of a normal distribution. At α = 2 the convergence can be very slow; for tail slopes more horizontal, α < 2, convergence is to a stable distribution of the same α. Convergence is more rapid as α → 0, at which point the distribution becomes degenerate.
Convergence of sums of random variables.
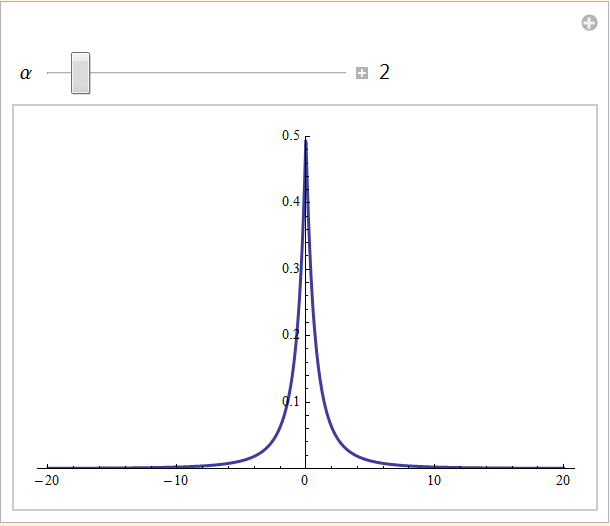
In this section, we will experiment with sums of random variables. We will use a contrived distribution derived from the GPD to make a two tailed Pareto distribution. We will use a version of this distribution centered at zero, it is symmetric so we would expect sums of random variables to converge to a somewhat symmetric stable distribution when α < 2, and a normal distribution when α > 2. The density function of the distribution is shown in the picture below.
What you see below are four curves: in blue is the normal distribution, in red is the exponential distribution, in gold is the GPD, matched to the value of α selected. In green you have the empirical distribution from the summed sample generated. If you select n = 1, the empirical distribution should match closely the GPD, i.e. there has been no summation of random variables. As you increase the number of summed random variables to 512, you will see the tail behavior of the empirical distribution move toward the normal distribution. With each sample you are generating 4096 × n random variables so expect execution to be slow for n > 512, unless you have a very fast computer. What you will observe is that if the highest α = 20 is selected, there will be pretty good convergence to the normal tail. For α < 4, the tail behavior of the summed random variables will not often reach the tail of the exponential distribution. When you select α less than 2 you will see that the tail behavior of the empirical distribution in green remains parallel to the GPD in gold. The tails may not superimpose if the scaling was not perfect. What you are considering is the slope of the tail to determine the α of the empirical distribution.
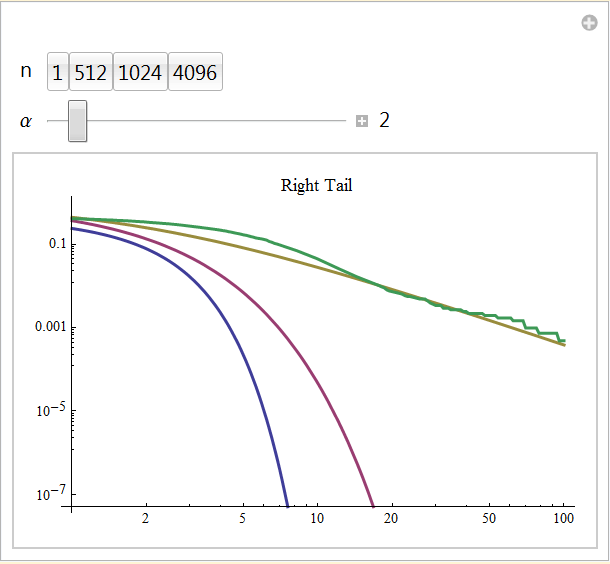
To have this demonstration execute in a reasonable time, a compromise was struck between the need to sum a lot of random variables and also to have the sample size of the summed random variables be large enough to demonstrate tail behavior. The sample size was chosen to be 4096, so that the order of magnitude of P[{X>x}] should be smaller than ![]() , if you select a partition size for the number of random variables summed at 4096, you will be generating
, if you select a partition size for the number of random variables summed at 4096, you will be generating ![]() random variables and this will take some time. A compiled Mathematica function is used, but this helps only a little. Therefore, be prepared to wait a while for execution if you select n = 4096, or even 1024 on a slow computer. The normal distribution shown has a σ of
random variables and this will take some time. A compiled Mathematica function is used, but this helps only a little. Therefore, be prepared to wait a while for execution if you select n = 4096, or even 1024 on a slow computer. The normal distribution shown has a σ of ![]() , to make the convergence line up with stable distribution centrally so a probability of
, to make the convergence line up with stable distribution centrally so a probability of ![]() , implies a value on the x axis of 4.37 and a probability of
, implies a value on the x axis of 4.37 and a probability of ![]() , implies a value on the x axis of 5.26, you will not likely ever see the empirical distribution get out as far as x = 5 and also be on the normal tail.
, implies a value on the x axis of 5.26, you will not likely ever see the empirical distribution get out as far as x = 5 and also be on the normal tail.
What does this all mean?
First a Pareto tail model can be used to examine all heavy tailed distributions. For the simulation, a symmetric Pareto model was used on the hypothesis that this should converge more quickly as tail events should be balanced and tend to cancel out upon summation. An asymmetric distribution might converge more slowly. The exponential tail is a good dividing point to decide whether you have heavy tails in your data. There are some practical reasons for this approach. The exponential distribution is a pure tail distribution, its behavior is the same throughout. Thus you can select your data above some threshold and perform a quantile plot against and exponential [1], distribution. If the tail is exponential or lighter, you have light tailed data. If the tail is heavier, you can then plot the log of your tail against the same model, if it lines up linearly, you have a Pareto tail and the reciprocal of the slope is an estimate of α. For the left tail of your distribution you can center the distribution about zero, negate the data and repeat the above process. Sums of random variables from Pareto tails may converge very slowly if α is near 2. When a distribution has a tail behavior with α < 2, upon summation the Pareto tail behavior will never disappear and the distribution will converge to a stable distribution with the same tail behavior.
If you are dealing with heavy tails at a level of α that does not converge quickly, models which rely on tail behavior of the normal distribution will probably fail.
Further reading
Modelling of Extremal Events for Insurance and Finance, by Embrechts, Klüppelburg, and Mikosch, provides very comprehensive coverage of tail behavior. The text gives extensive reference to the mathematical literature.
Quantitative Risk Management, Concepts, Techniques, Tools, by McNeil, Frey, and Embrechts, is a little easier to read but still covers the material in some depth. It reviews many modeling techniques currently being used.
Note that the all authors of these books are mathematicians.
Comments about this document or error reports would be greatly appreciated, please email mathestate@gmail.com. The document contains only 40 lines of Mathematica code to create the graphics. More information about the computable document format can be found at http://www.wolfram.com/cdf/.
This document’s home page: TailBehavior.
mathestate ComputableDocumentFormat page.
Download this page as a computable document.
© Copyright 2011 Robert H. Rimmer 23 July 2011