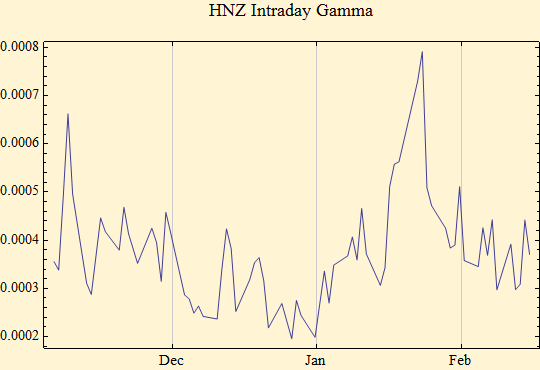
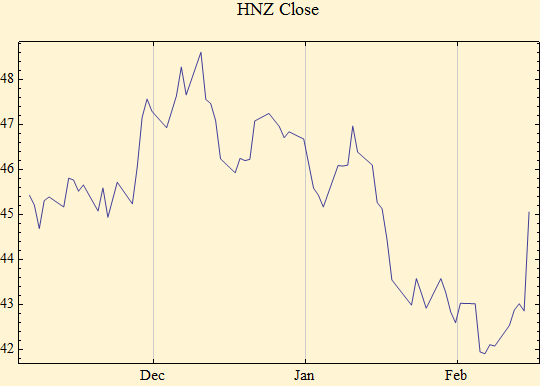
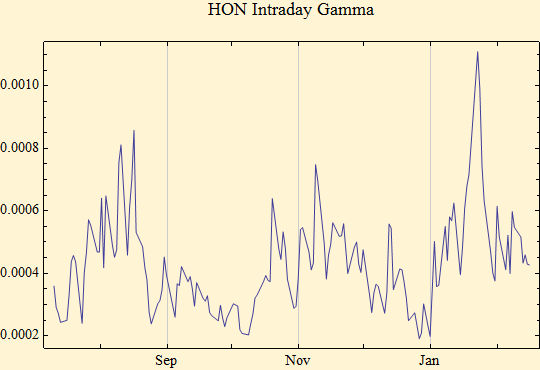
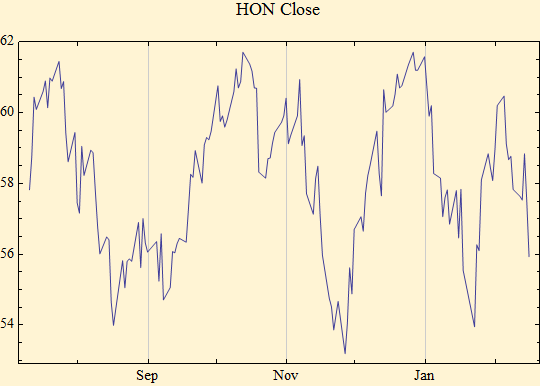
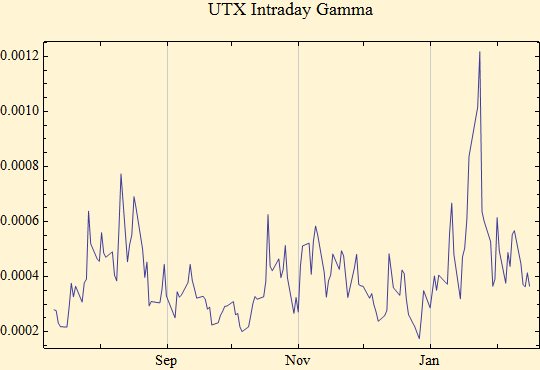
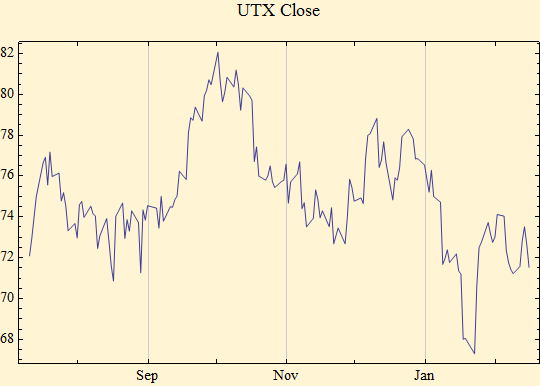
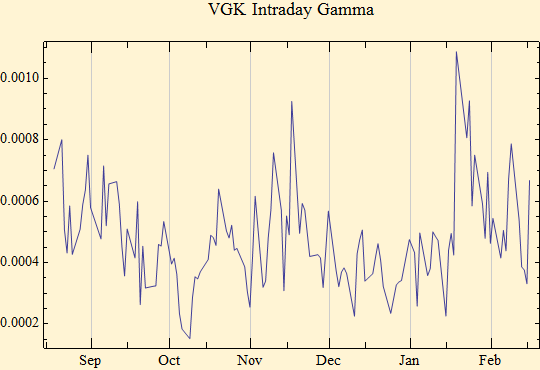
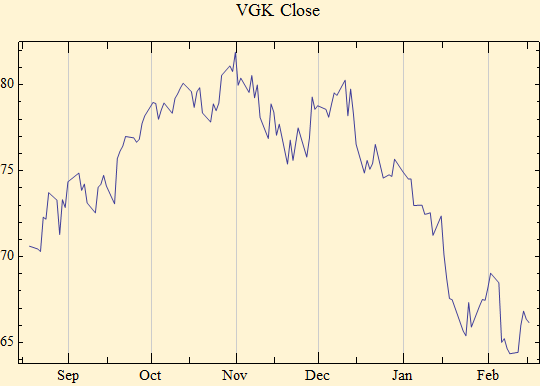
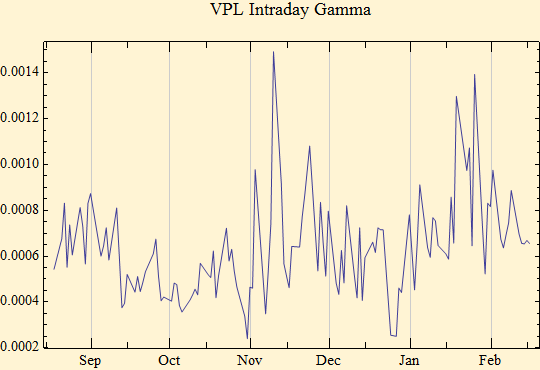
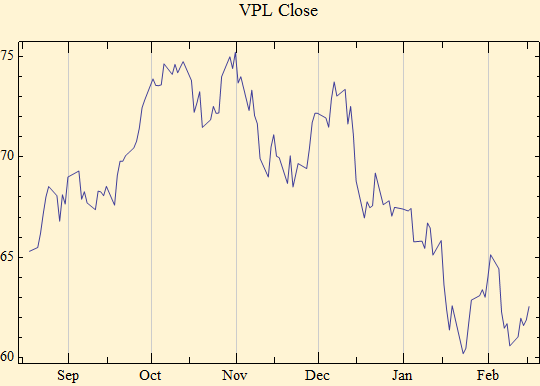
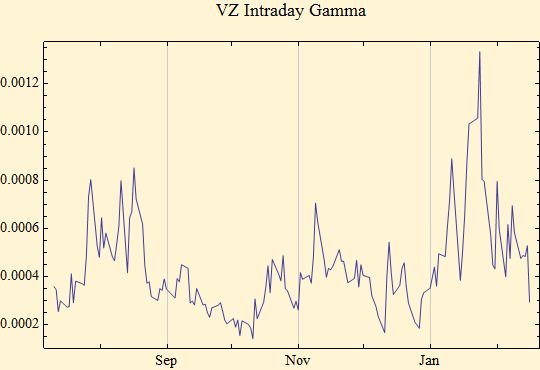
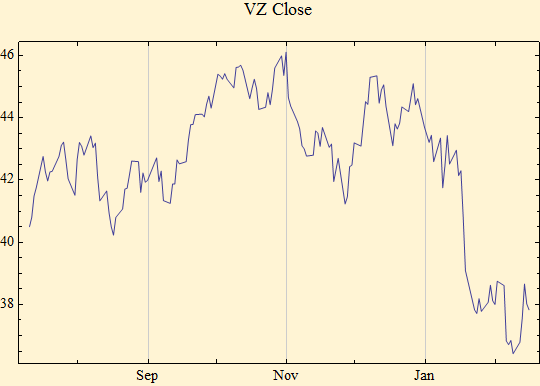
Mathestate Logo


Daily Volatility

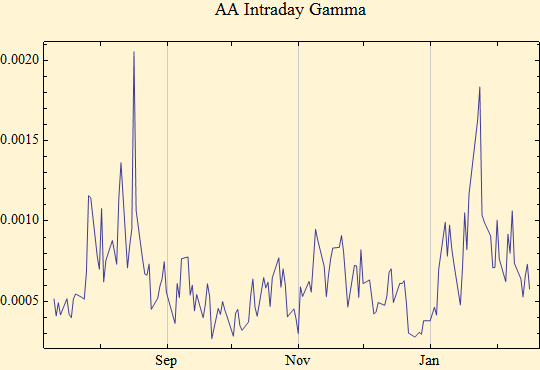
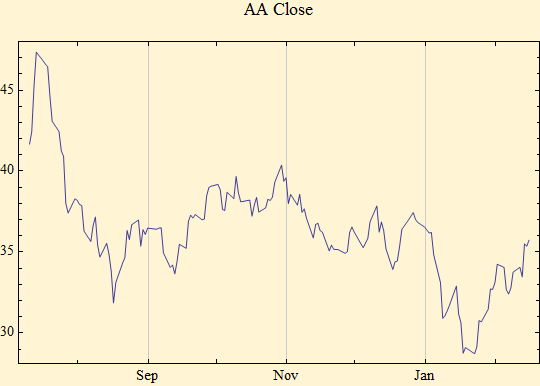
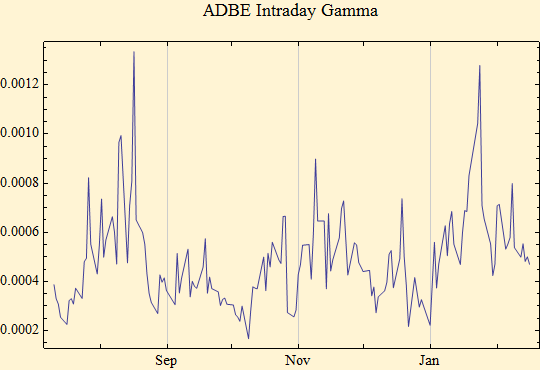
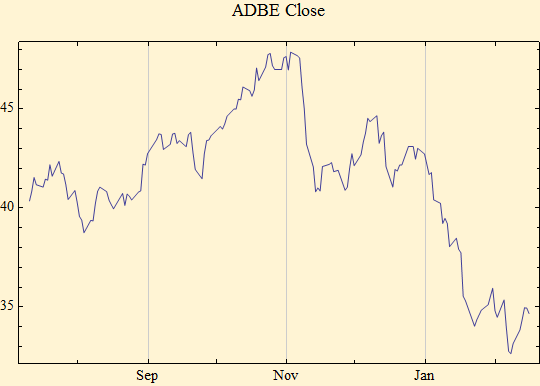
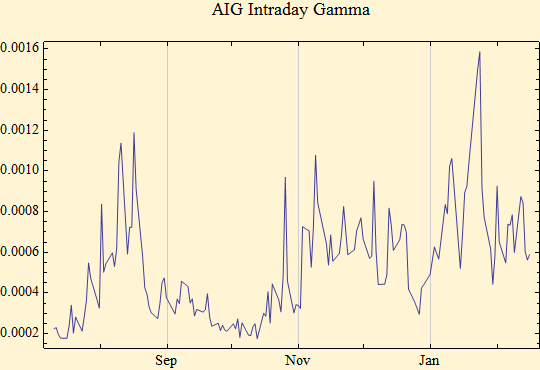
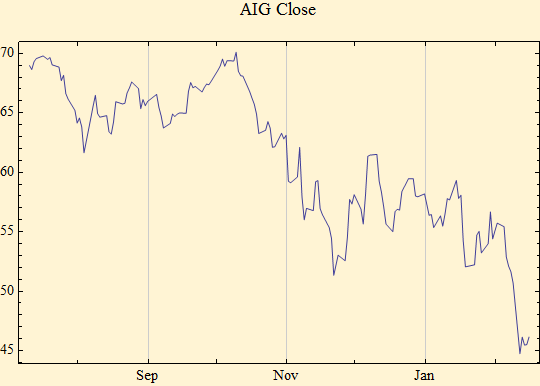
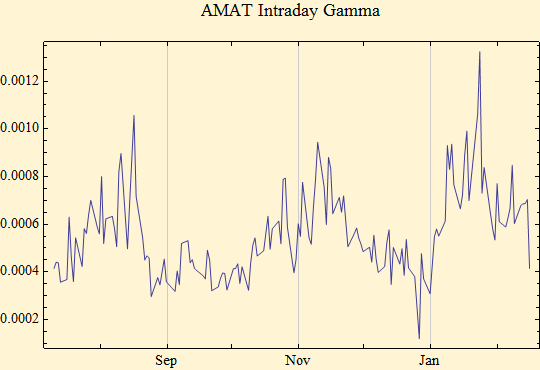
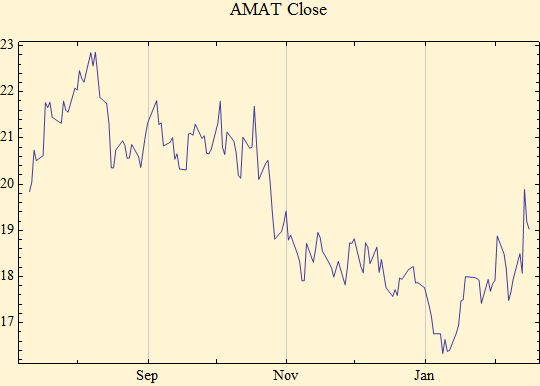
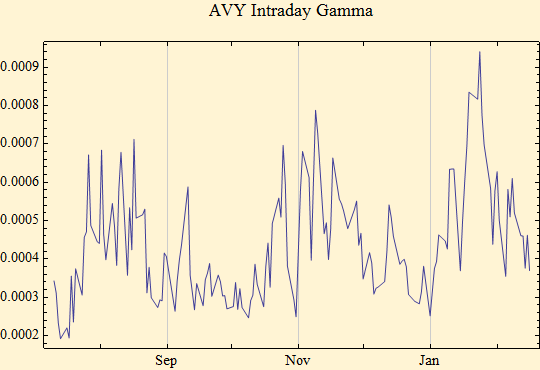
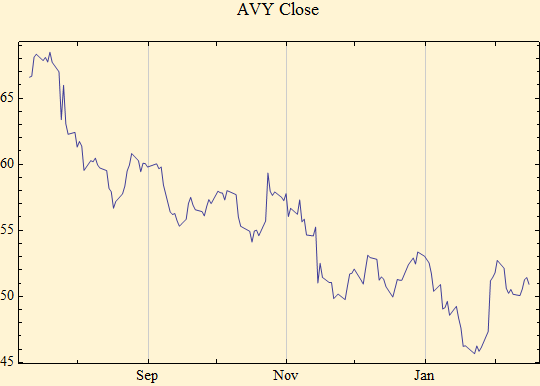
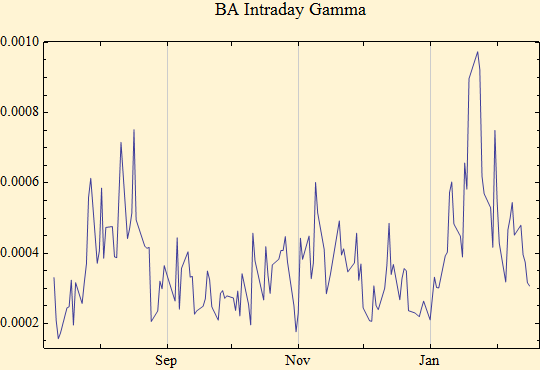
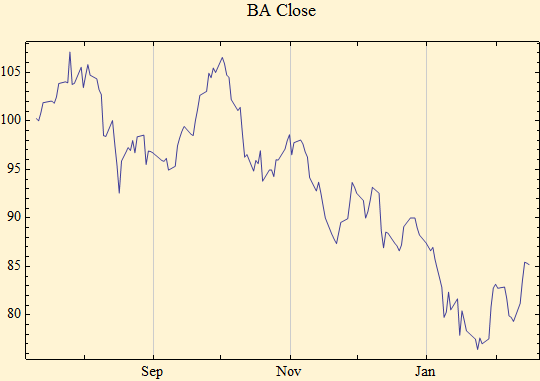
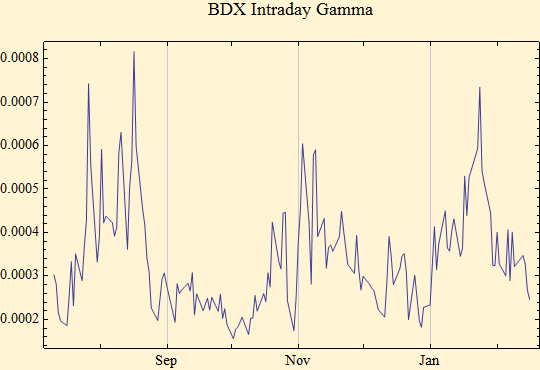
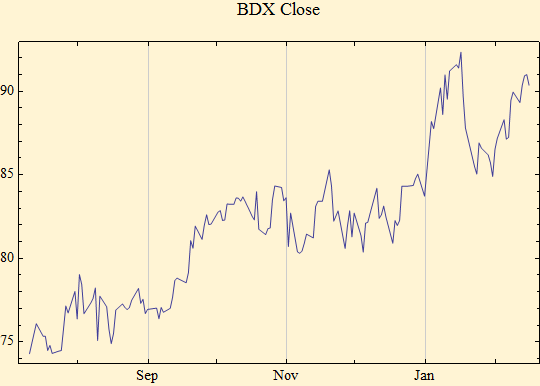
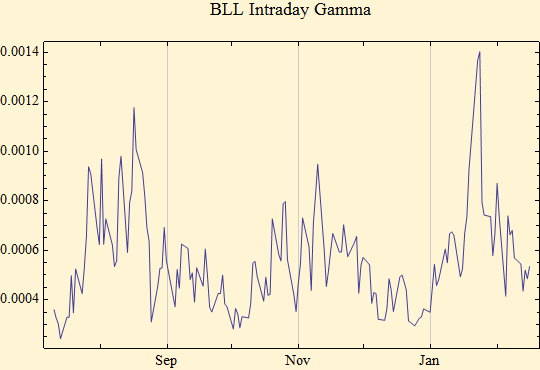
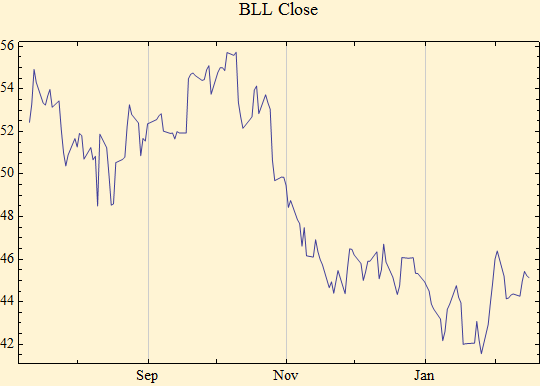
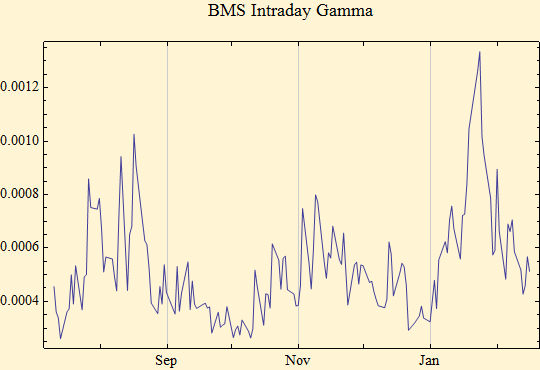
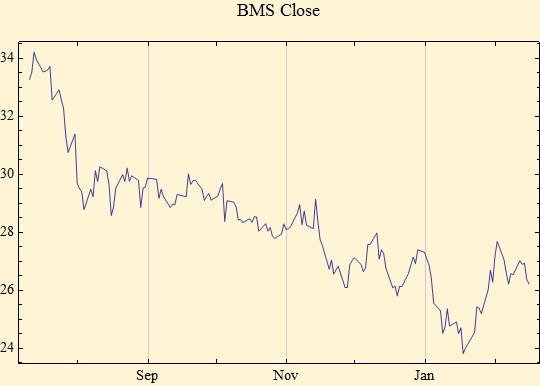
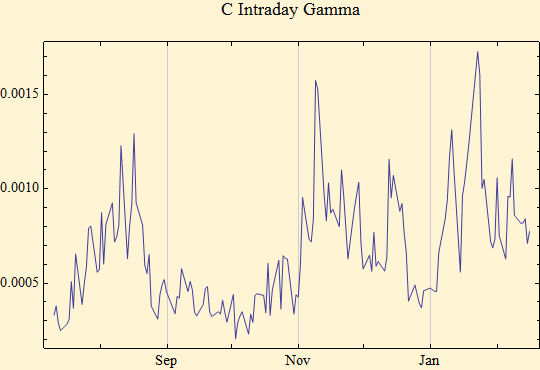
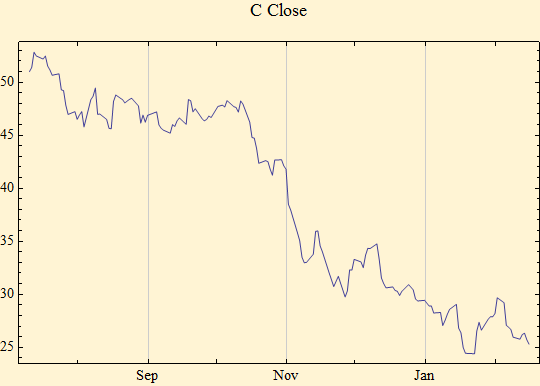
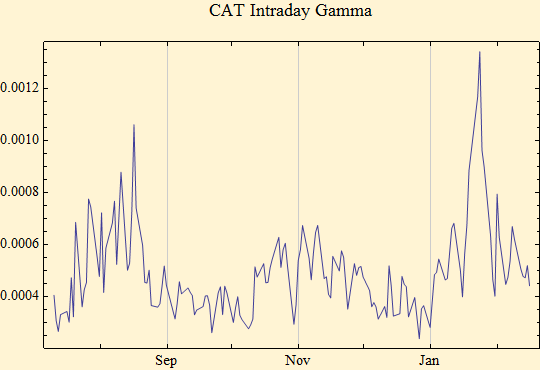
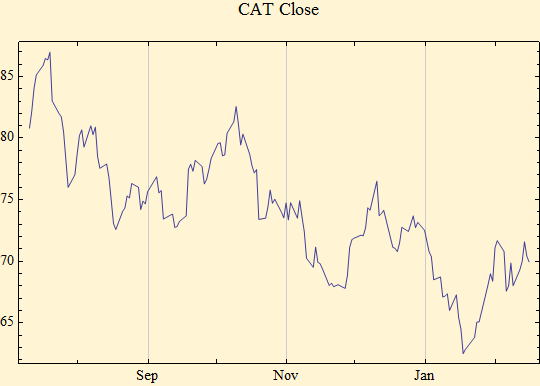
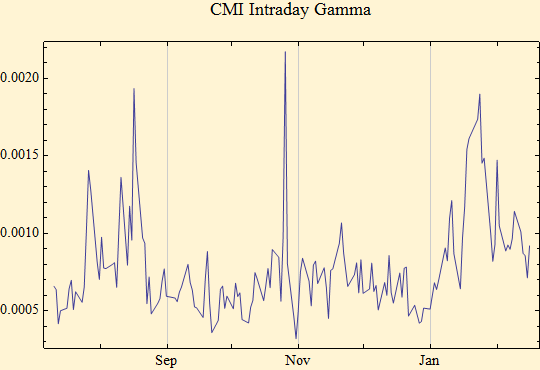
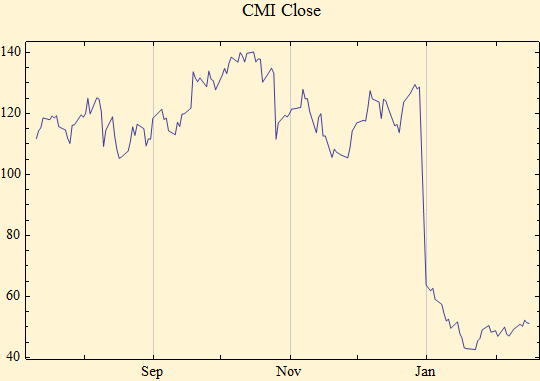
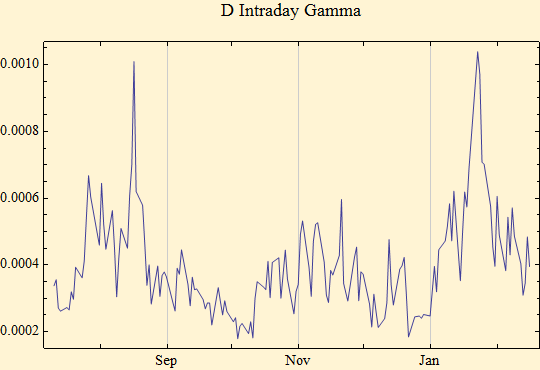
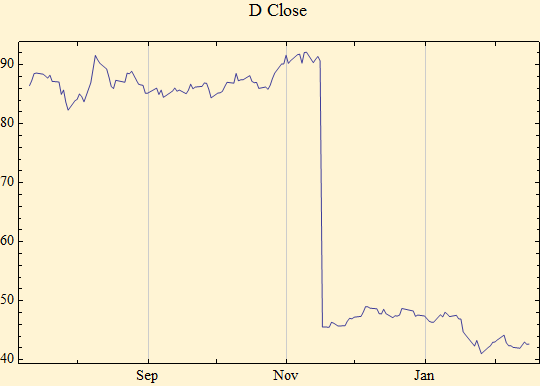
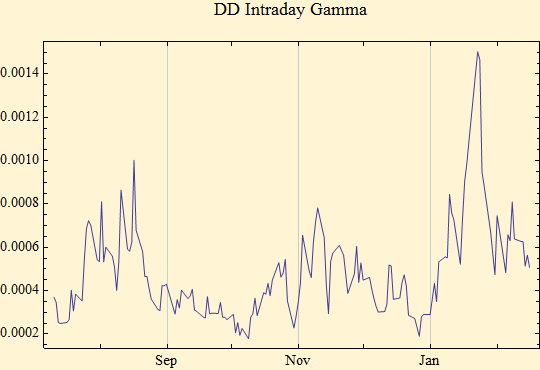
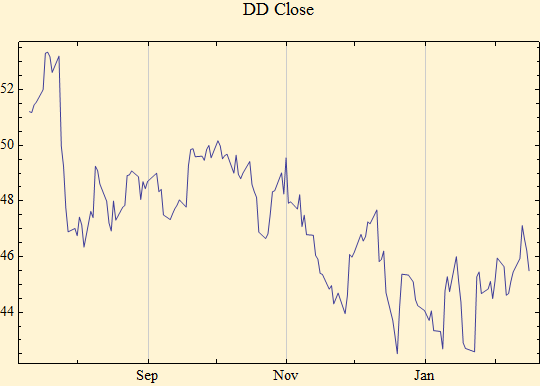
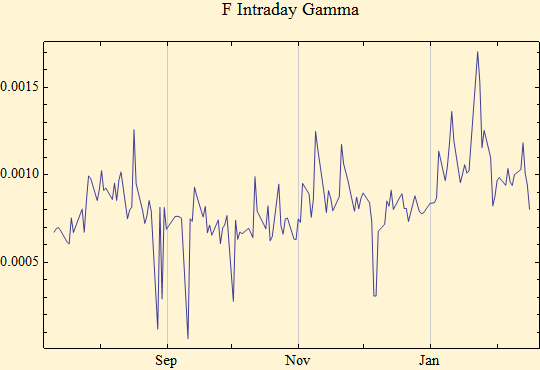
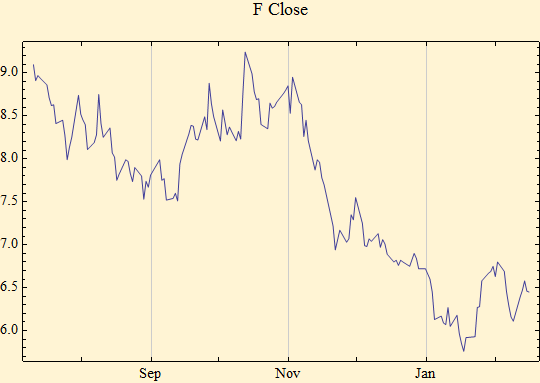
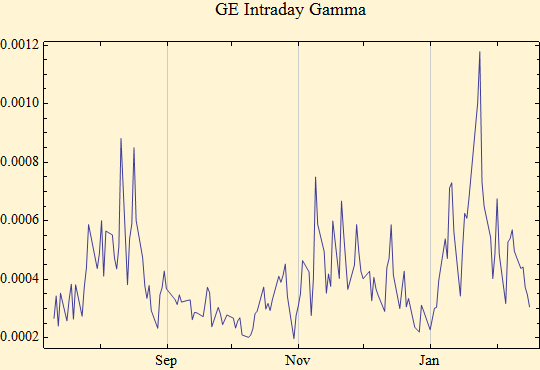
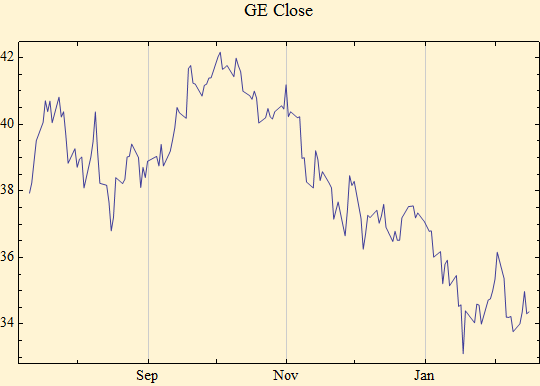
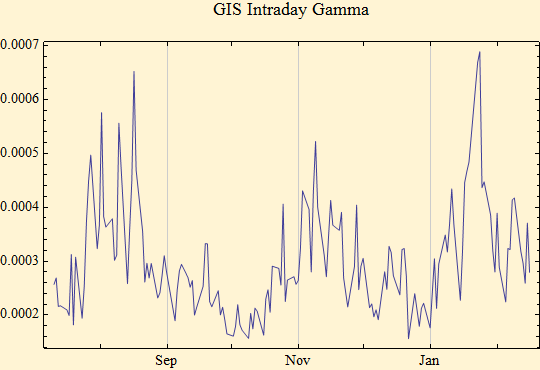
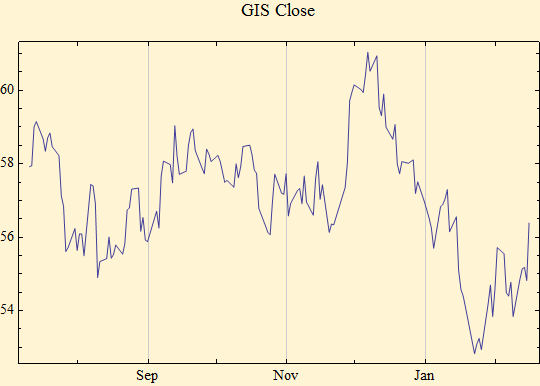
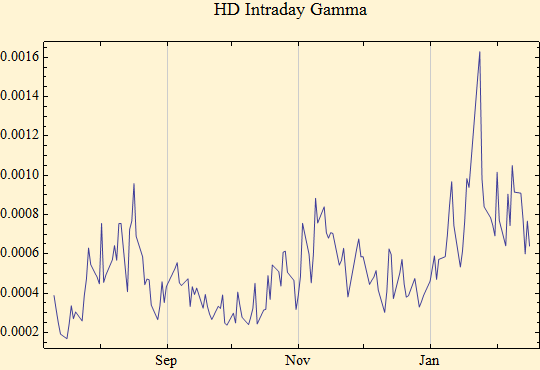
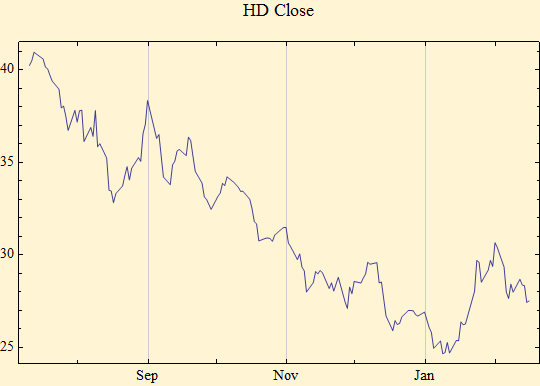
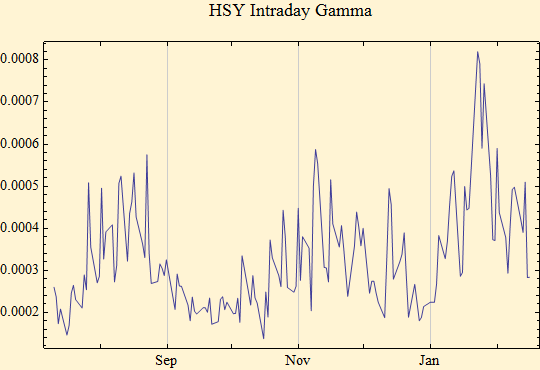
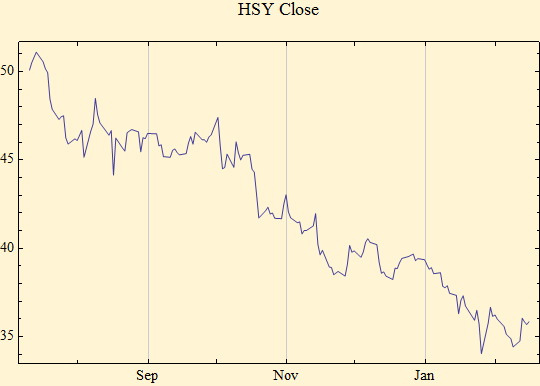
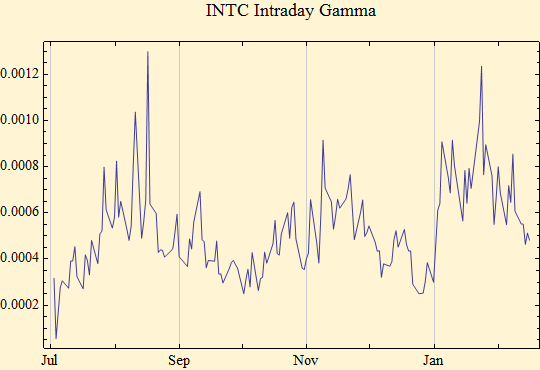
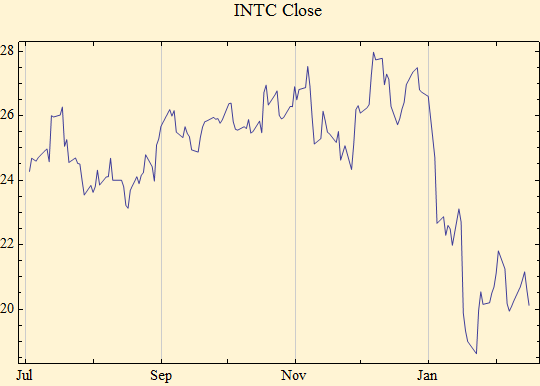
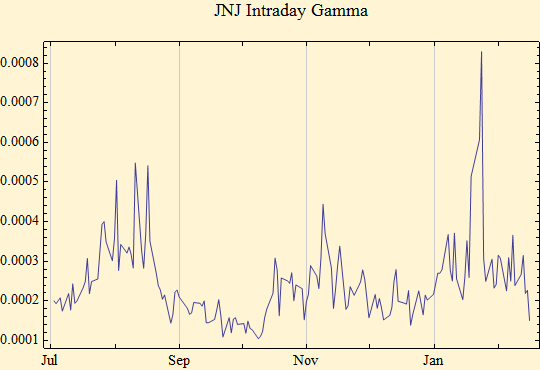
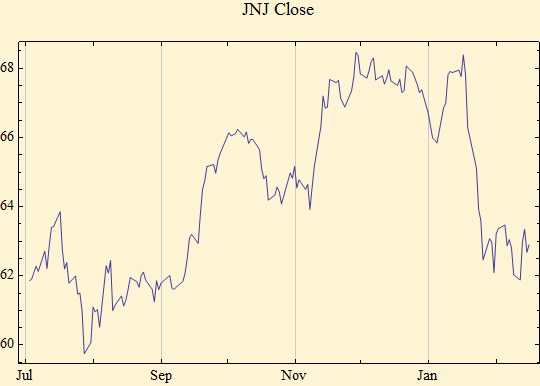
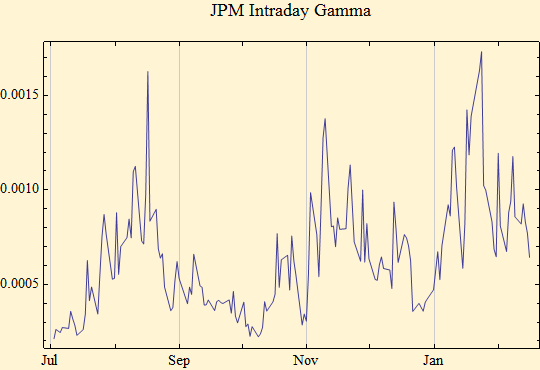
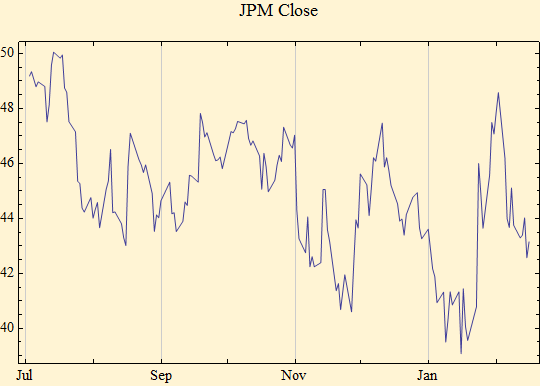
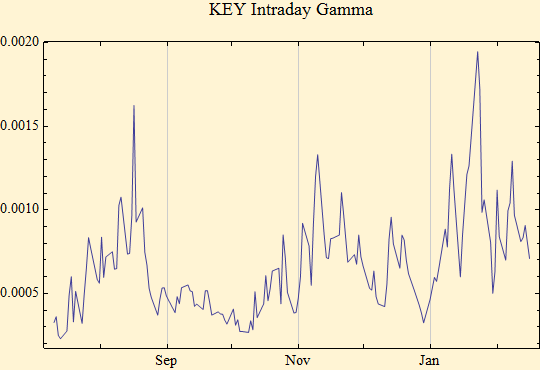
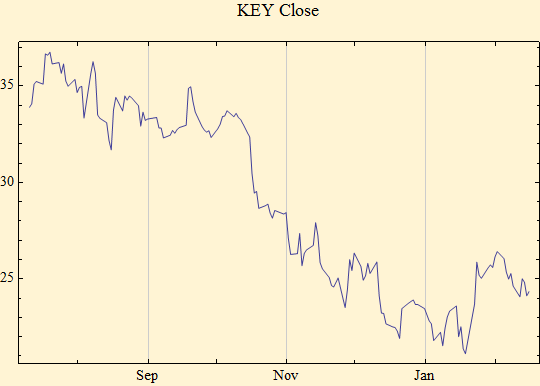
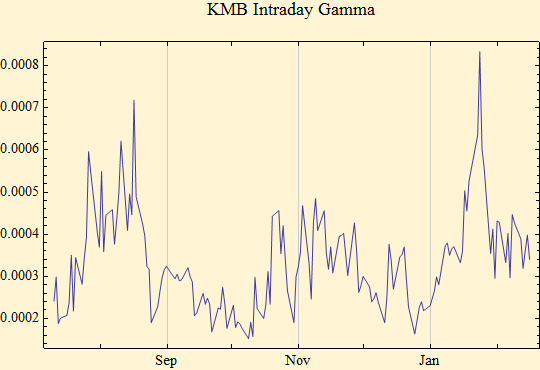
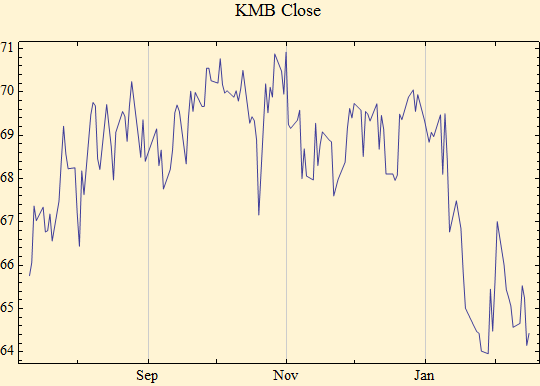
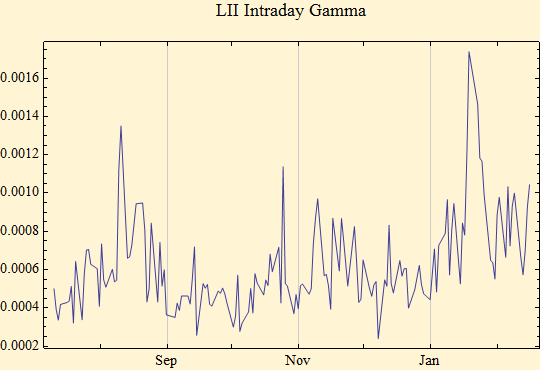
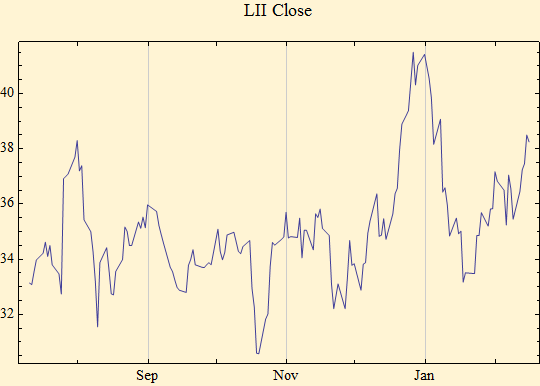
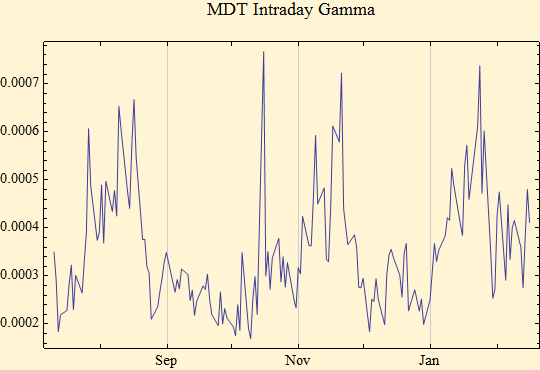
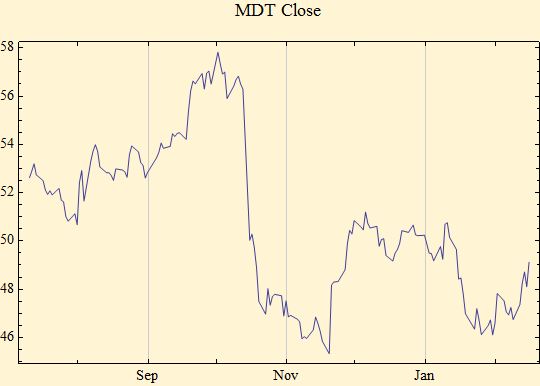
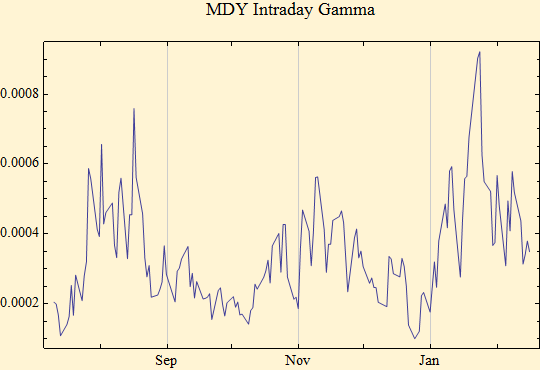
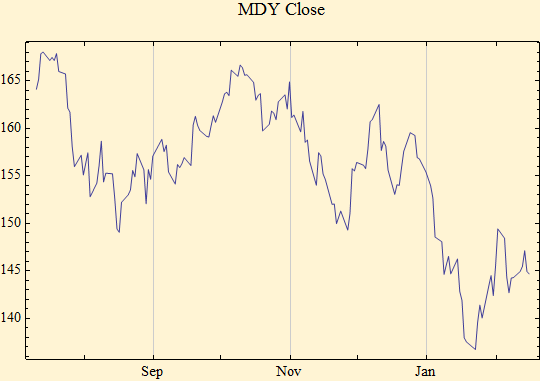
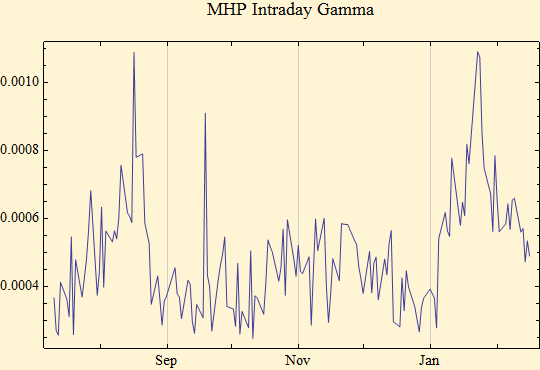
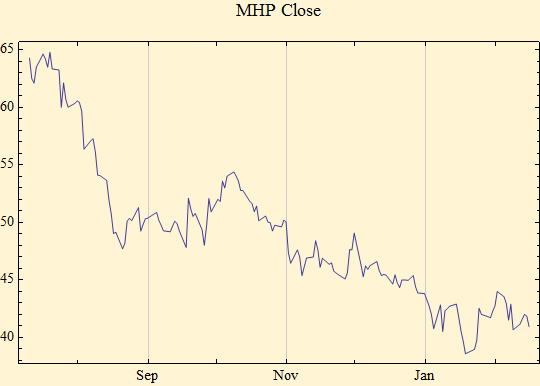
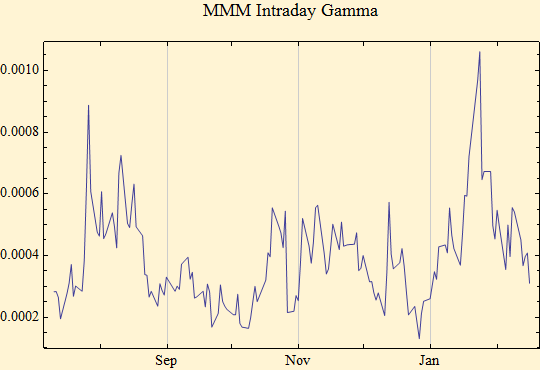
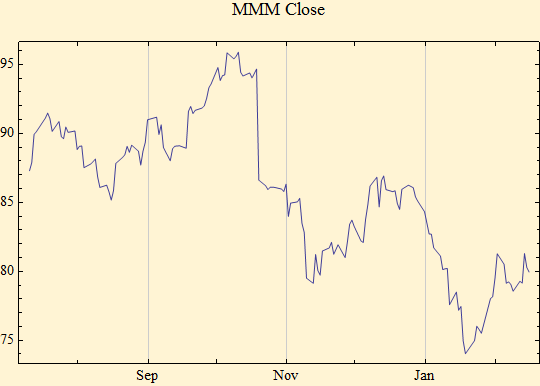
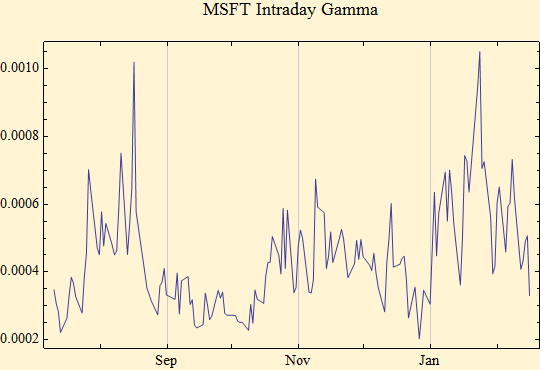
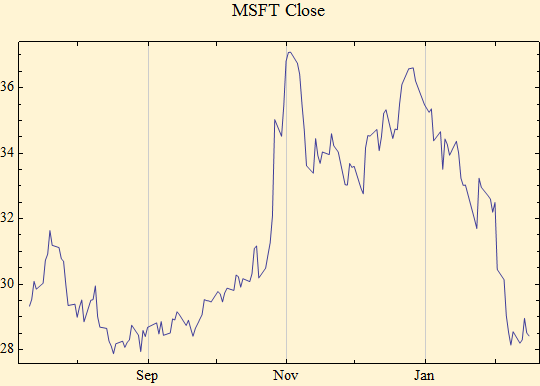
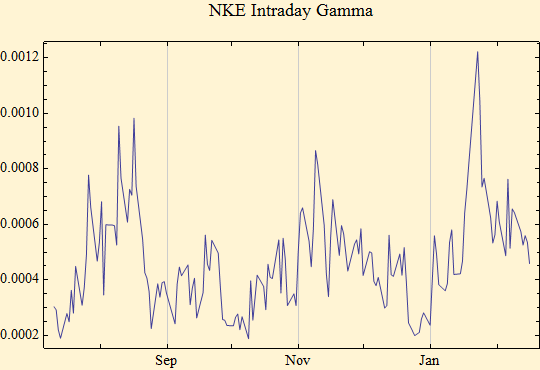
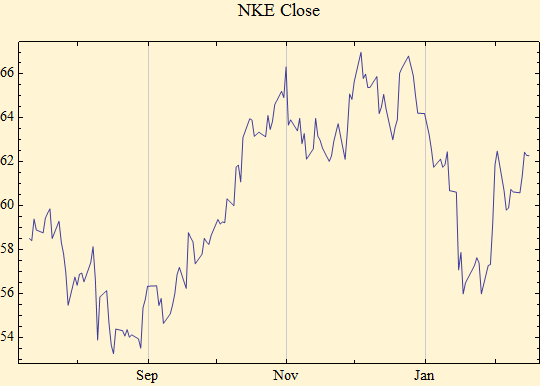
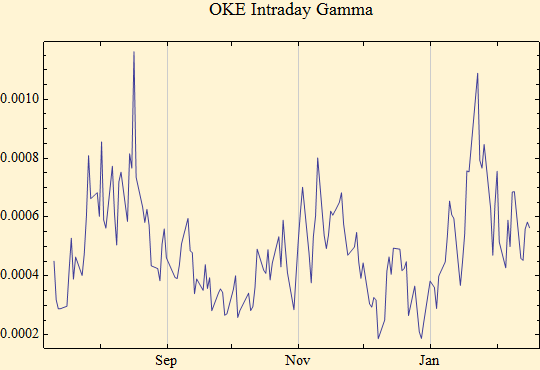
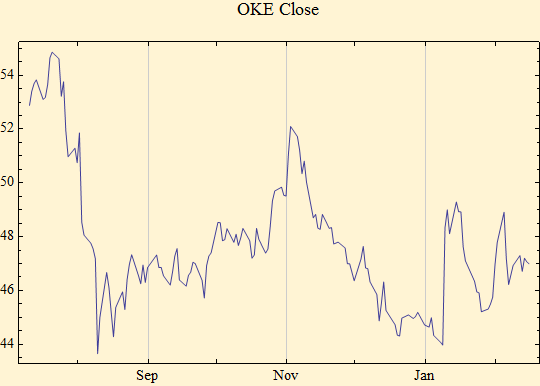
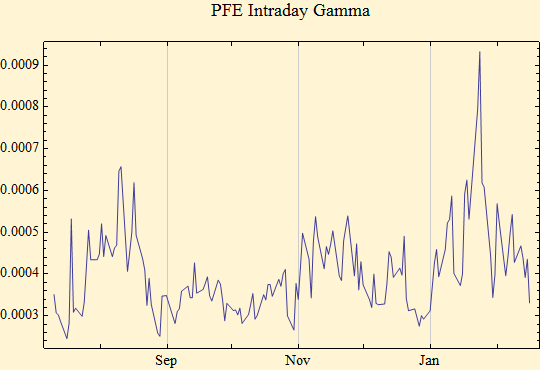
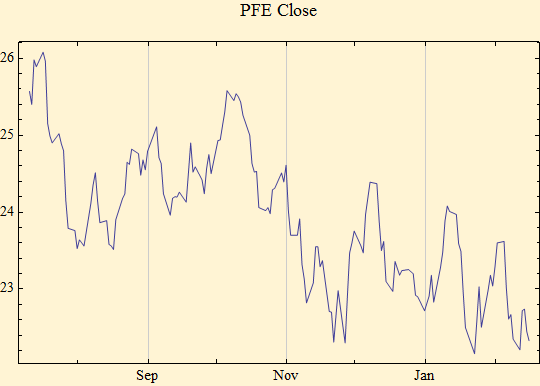
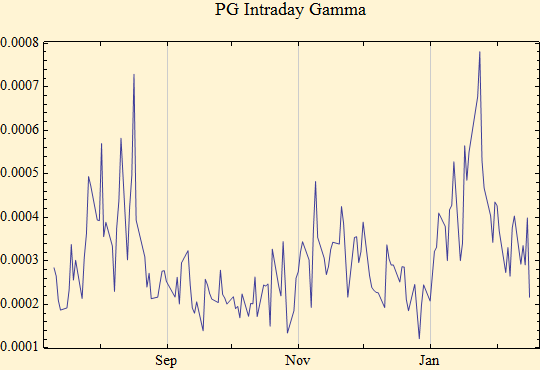
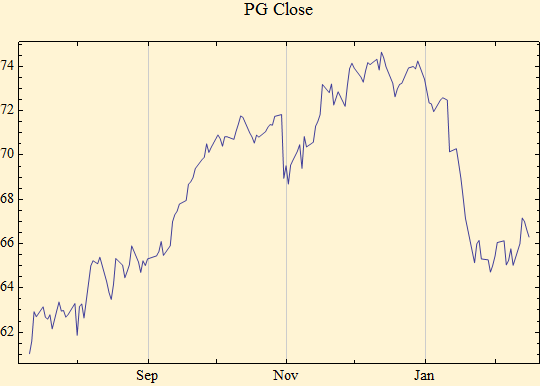
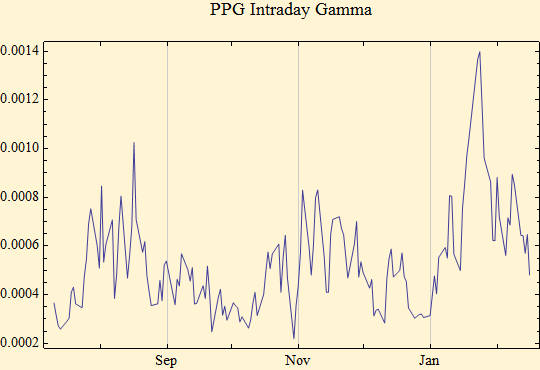
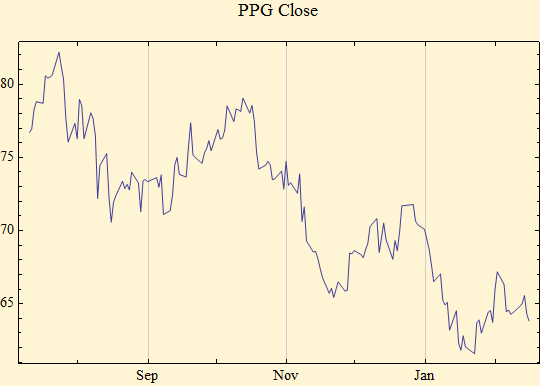
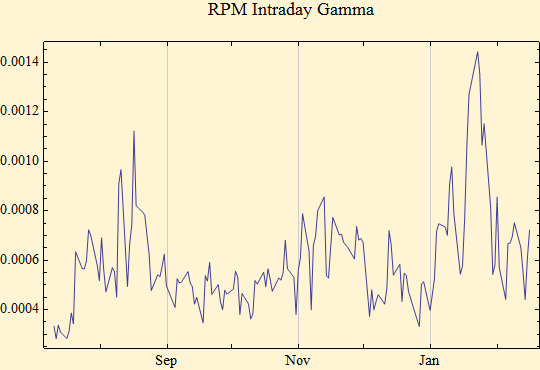
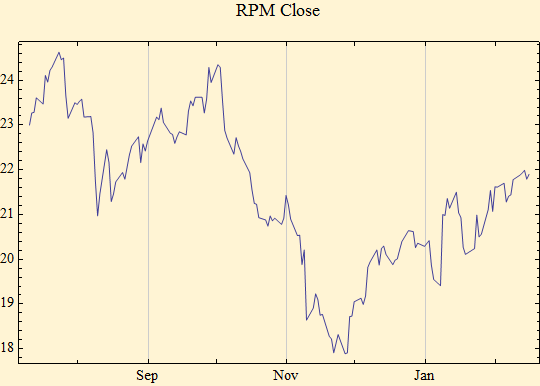
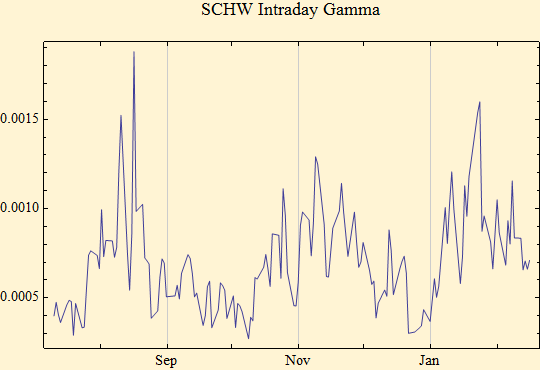
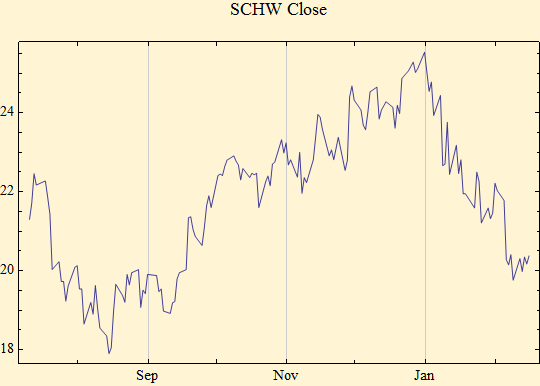
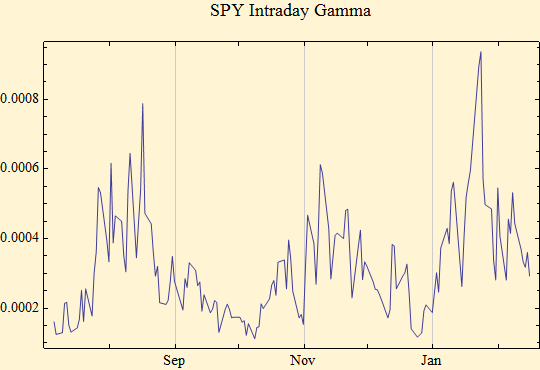
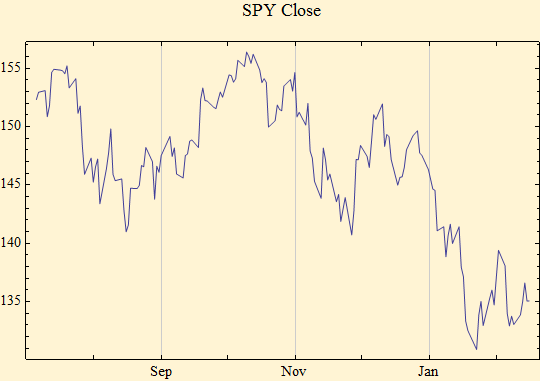
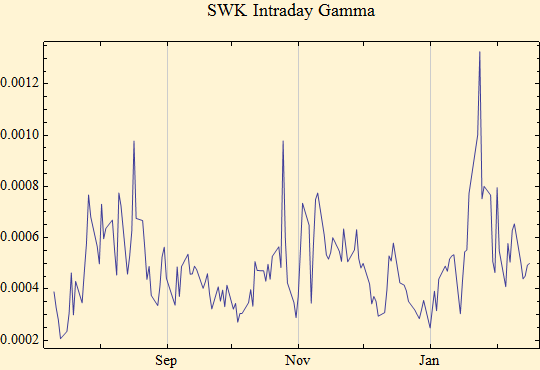
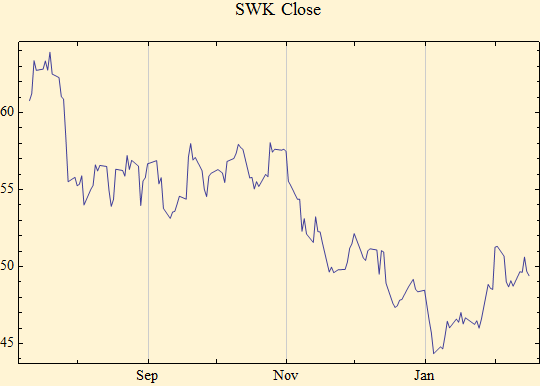
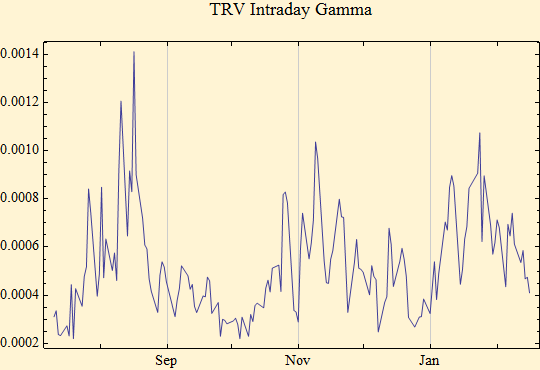
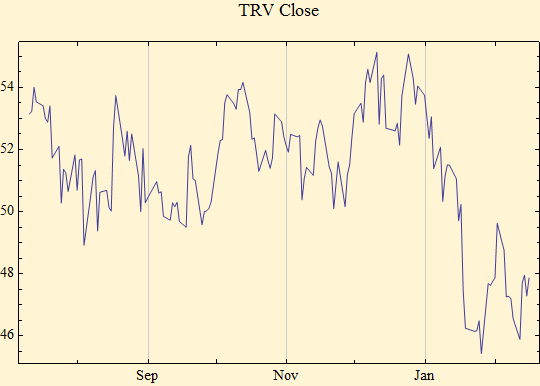
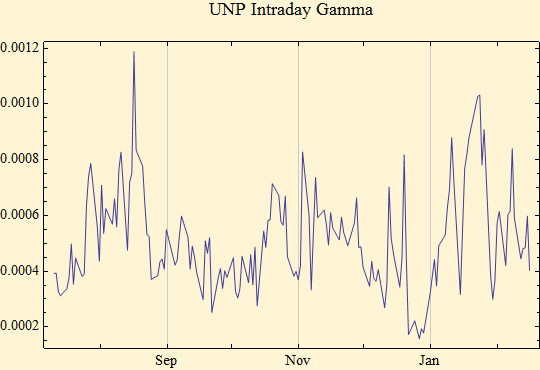
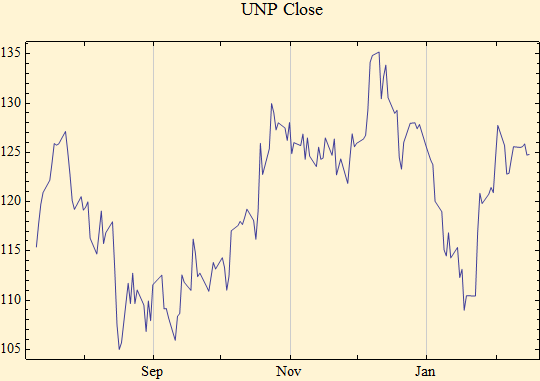
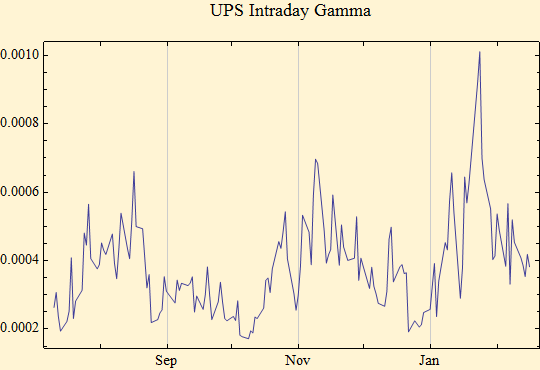
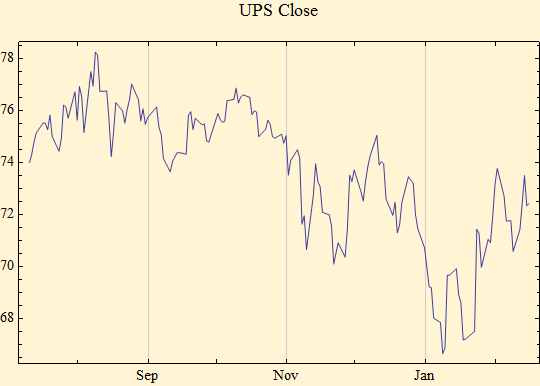
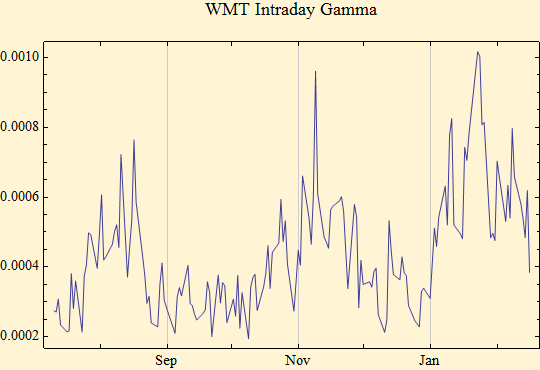
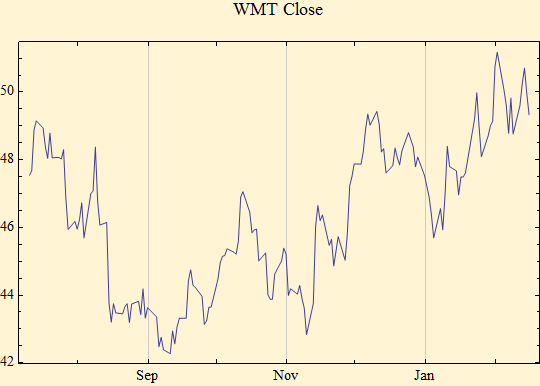
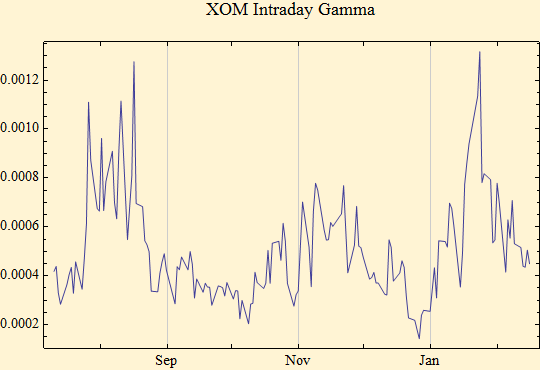
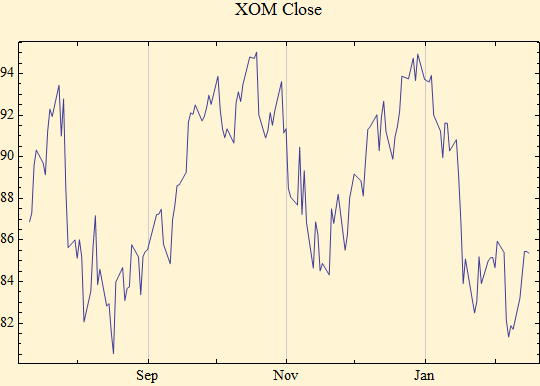
Below is a collection of graphs showing daily volatility for 50 stocks and ETFs traded on U.S. exchanges.  Most of the graphs have data beginning in July of 2007; the last data date is February 15, 2008.  Only raw minute by minute intraday price changes were used for the calculation of gamma and the closing price graph has the last price of the the day.  Two stocks in the series had two for one share splits (CMI, D).  The prices were not adjusted; and it can be seen that the one extreme return did not much affect the gamma calculation in these series.  In general the graphs show the same cyclic pattern of rising and falling volatility of a broad market indicator like the SPF ETF.

Graphics:AA Intraday Gamma

Graphics:AA Close

Graphics:ADBE Intraday Gamma

Graphics:ADBE Close

Graphics:AIG Intraday Gamma

Graphics:AIG Close

Graphics:AMAT Intraday Gamma

Graphics:AMAT Close

Graphics:AVY Intraday Gamma

Graphics:AVY Close

Graphics:BA Intraday Gamma

Graphics:BA Close

Graphics:BDX Intraday Gamma

Graphics:BDX Close

Graphics:BLL Intraday Gamma

Graphics:BLL Close

Graphics:BMS Intraday Gamma

Graphics:BMS Close

Graphics:C Intraday Gamma

Graphics:C Close

Graphics:CAT Intraday Gamma

Graphics:CAT Close

Graphics:CMI Intraday Gamma

Graphics:CMI Close

Graphics:D Intraday Gamma

Graphics:D Close

Graphics:DD Intraday Gamma

Graphics:DD Close

Graphics:F Intraday Gamma

Graphics:F Close

Graphics:GE Intraday Gamma

Graphics:GE Close

Graphics:GIS Intraday Gamma

Graphics:GIS Close

Graphics:HD Intraday Gamma

Graphics:HD Close

Graphics:HNZ Intraday Gamma

Graphics:HNZ Close

Graphics:HON Intraday Gamma

Graphics:HON Close

Graphics:HSY Intraday Gamma

Graphics:HSY Close

Graphics:INTC Intraday Gamma

Graphics:INTC Close

Graphics:JNJ Intraday Gamma

Graphics:JNJ Close

Graphics:JPM Intraday Gamma

Graphics:JPM Close

Graphics:KEY Intraday Gamma

Graphics:KEY Close

Graphics:KMB Intraday Gamma

Graphics:KMB Close

Graphics:LII Intraday Gamma

Graphics:LII Close

Graphics:MDT Intraday Gamma

Graphics:MDT Close

Graphics:MDY Intraday Gamma

Graphics:MDY Close

Graphics:MHP Intraday Gamma

Graphics:MHP Close

Graphics:MMM Intraday Gamma

Graphics:MMM Close

Graphics:MSFT Intraday Gamma

Graphics:MSFT Close

Graphics:NKE Intraday Gamma

Graphics:NKE Close

Graphics:OKE Intraday Gamma

Graphics:OKE Close

Graphics:PFE Intraday Gamma

Graphics:PFE Close

Graphics:PG Intraday Gamma

Graphics:PG Close

Graphics:PPG Intraday Gamma

Graphics:PPG Close

Graphics:RPM Intraday Gamma

Graphics:RPM Close

Graphics:SCHW Intraday Gamma

Graphics:SCHW Close

Graphics:SPY Intraday Gamma

Graphics:SPY Close

Graphics:SWK Intraday Gamma

Graphics:SWK Close

Graphics:TRV Intraday Gamma

Graphics:TRV Close

Graphics:UNP Intraday Gamma

Graphics:UNP Close

Graphics:UPS Intraday Gamma

Graphics:UPS Close

Graphics:UTX Intraday Gamma

Graphics:UTX Close

Graphics:VGK Intraday Gamma

Graphics:VGK Close

Graphics:VPL Intraday Gamma

Graphics:VPL Close

Graphics:VZ Intraday Gamma

Graphics:VZ Close

Graphics:WMT Intraday Gamma

Graphics:WMT Close

Graphics:XOM Intraday Gamma

Graphics:XOM Close

The downloadable Mathematica notebook does not contain the data separately from the images.  However, the data can be recovered from the image.  Select the image, then select Show Expression from the Cell menu; the image will be converted to the Mathematica code.  Copy the string contained in "CompressedData" and use the function Uncompress on this string.  You will recover the data.  

DailyVolatility_101.gif


© Copyright 2008 mathestate    Fri 22 Feb 2008