Fit Gallery
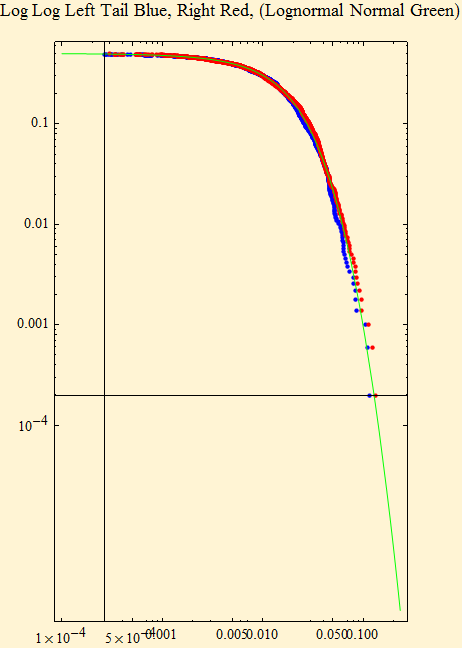
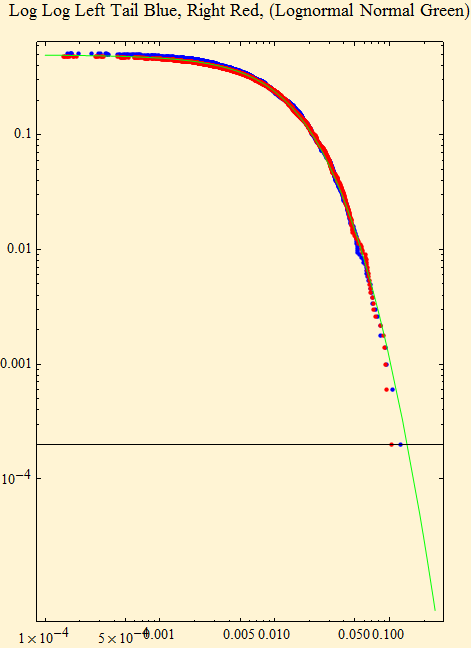
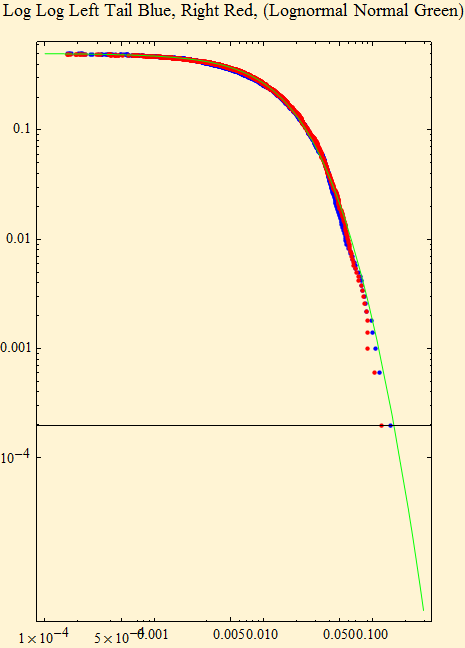
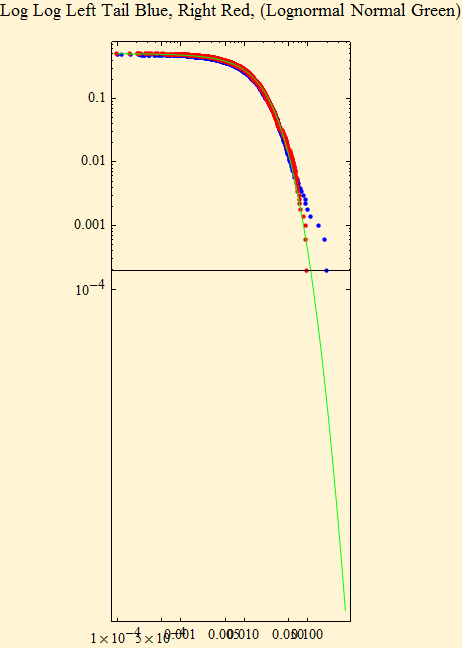
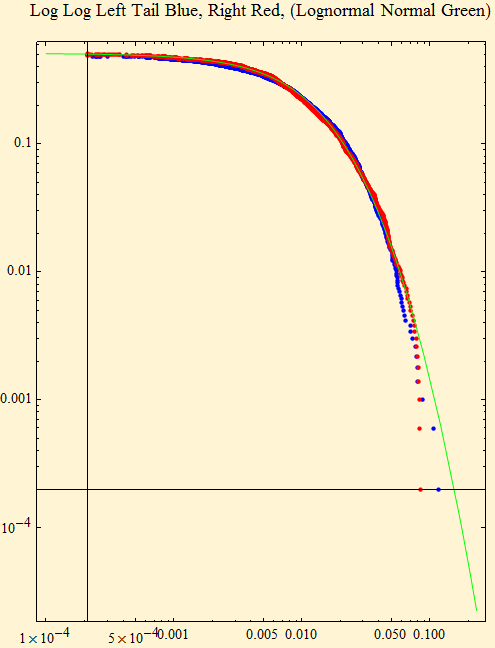
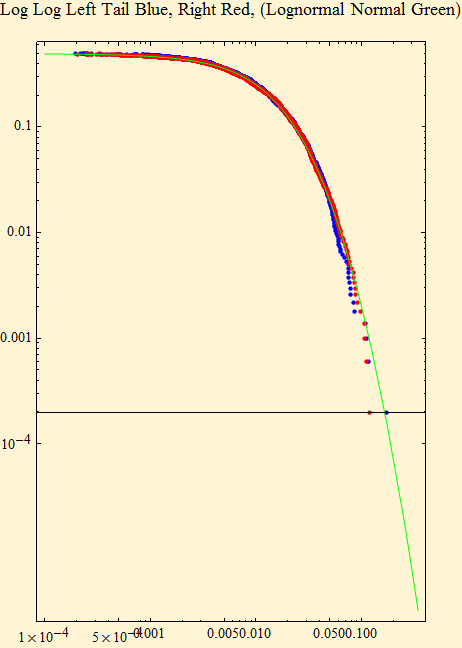
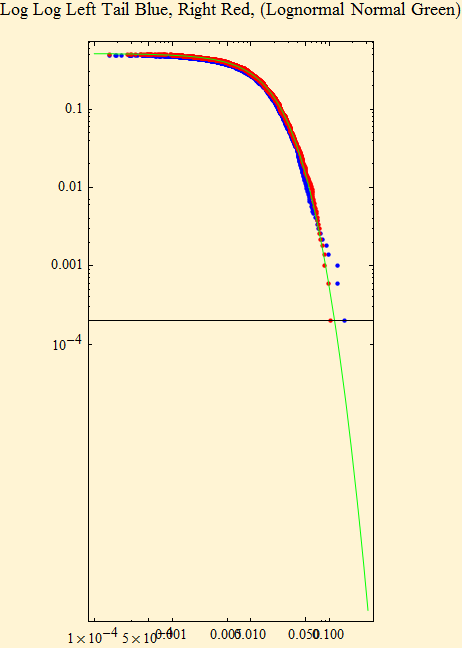
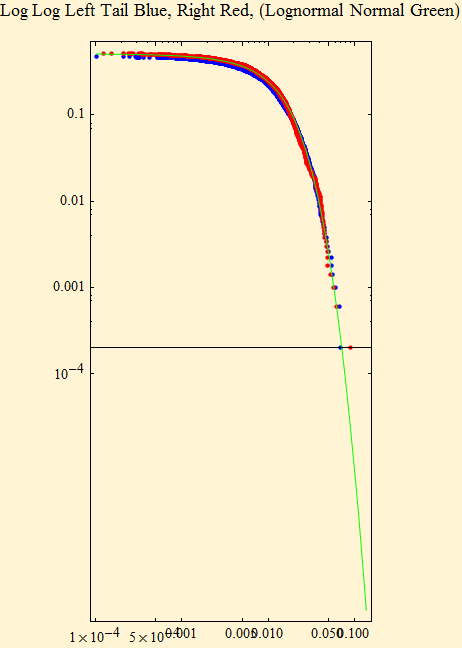
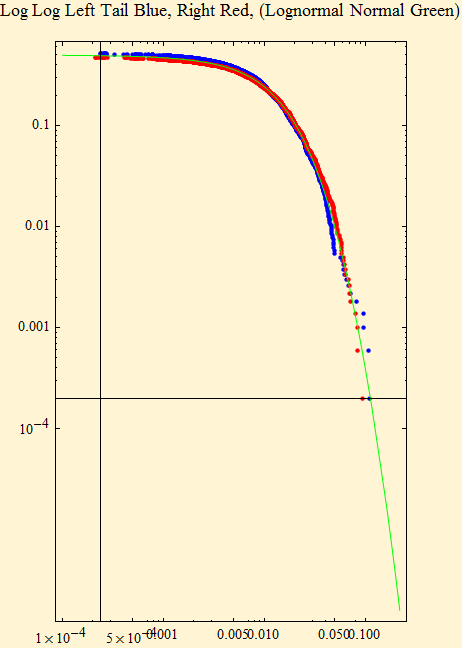
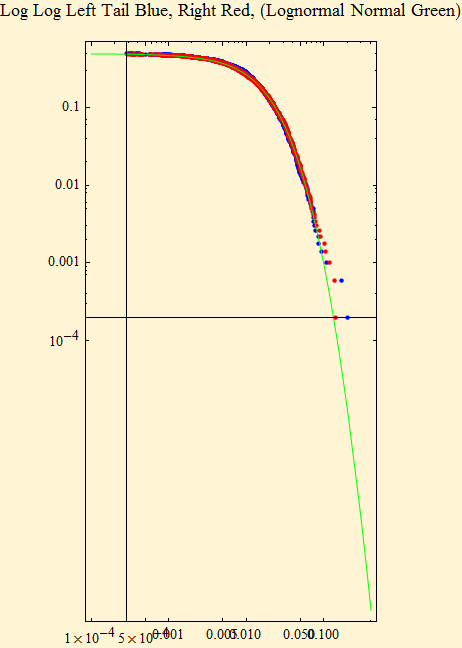
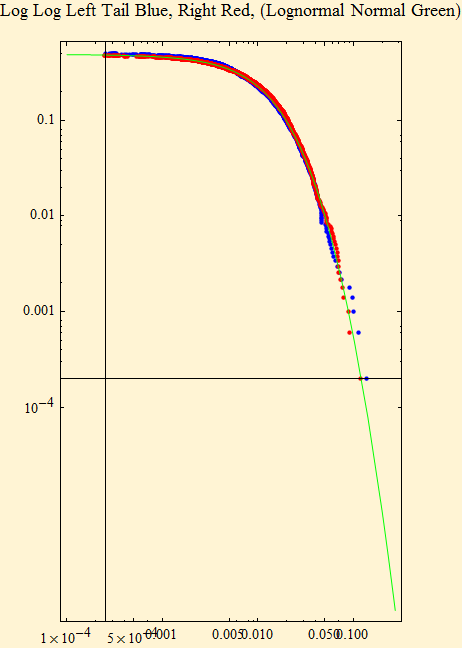
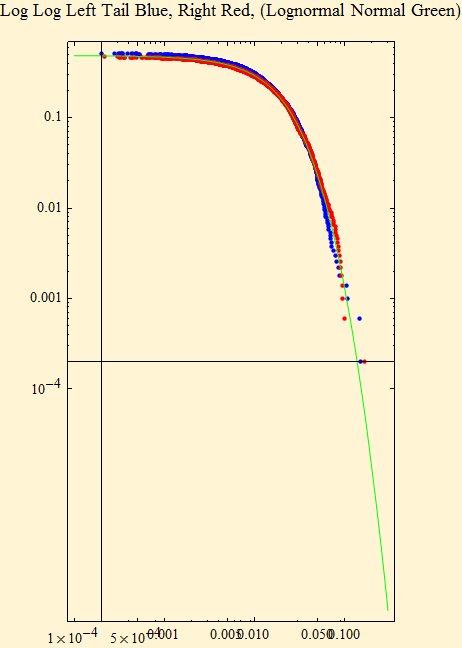
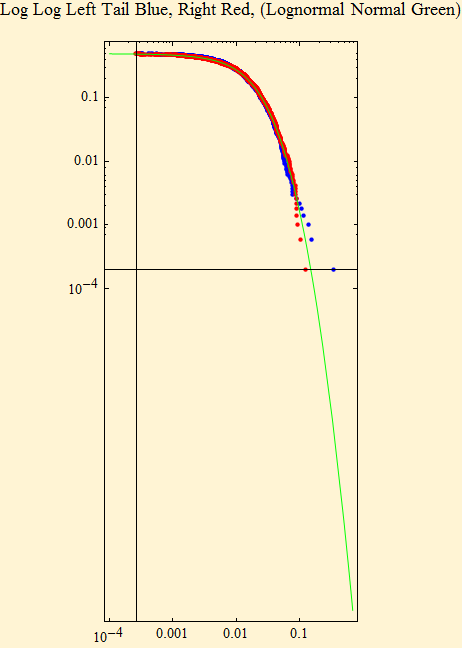
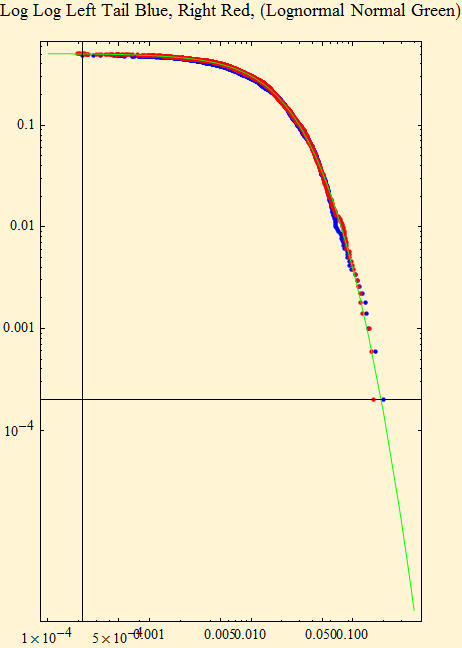
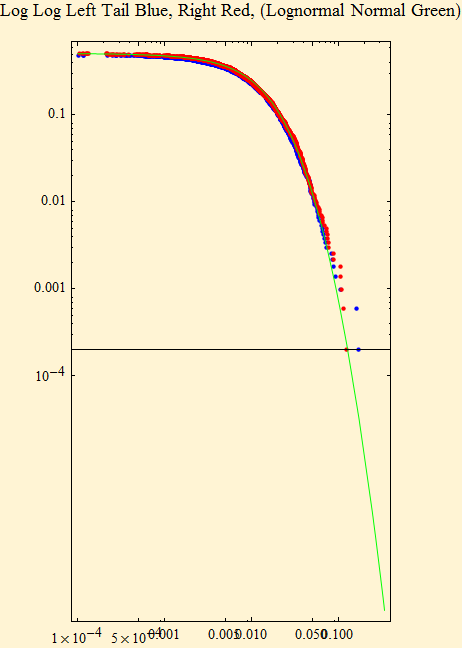
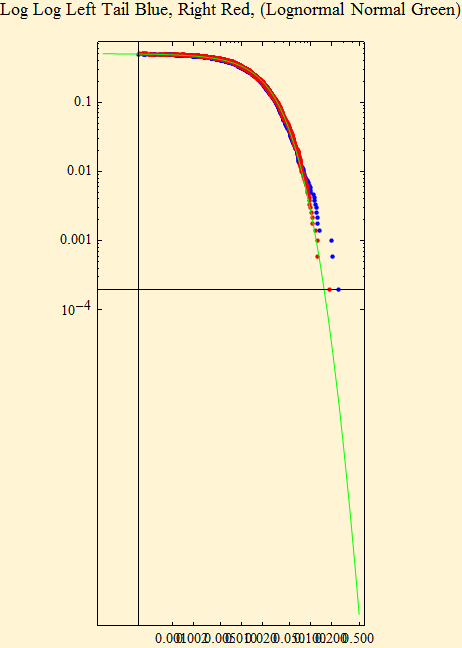
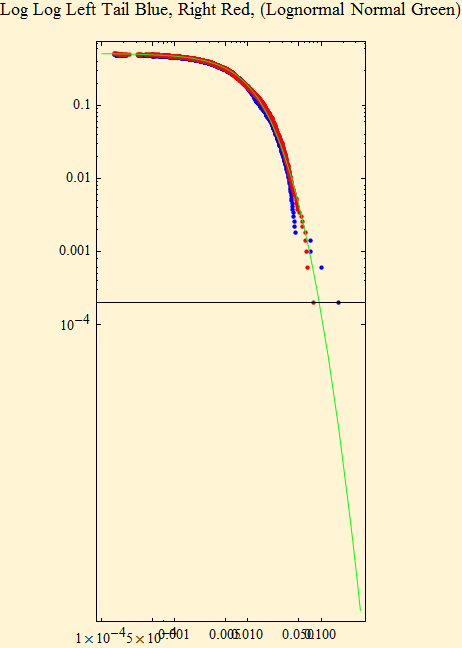
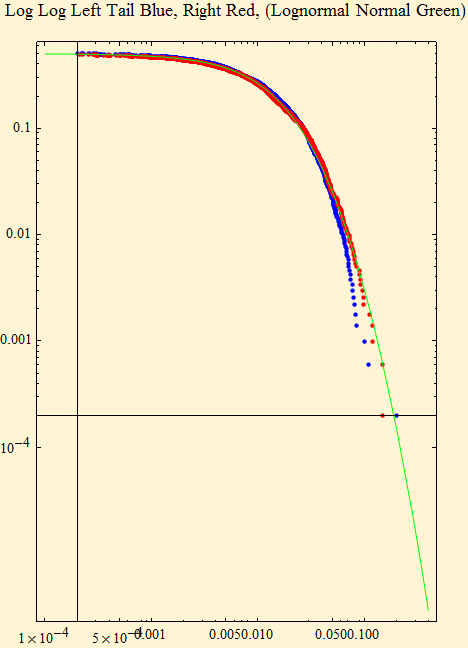
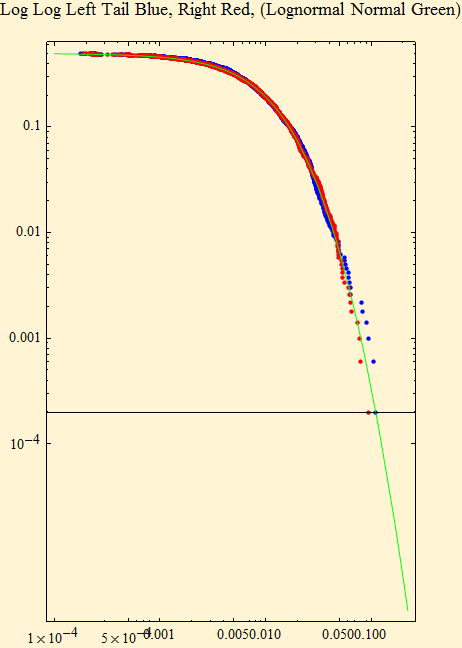
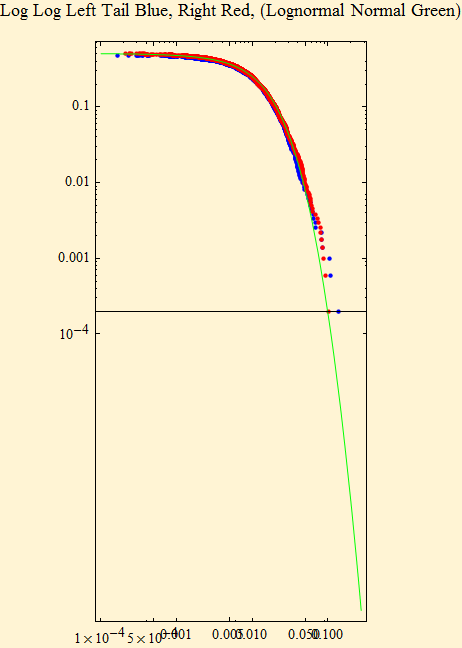
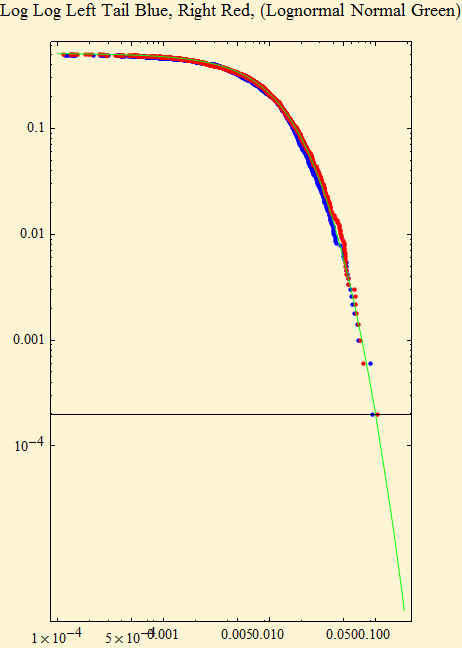
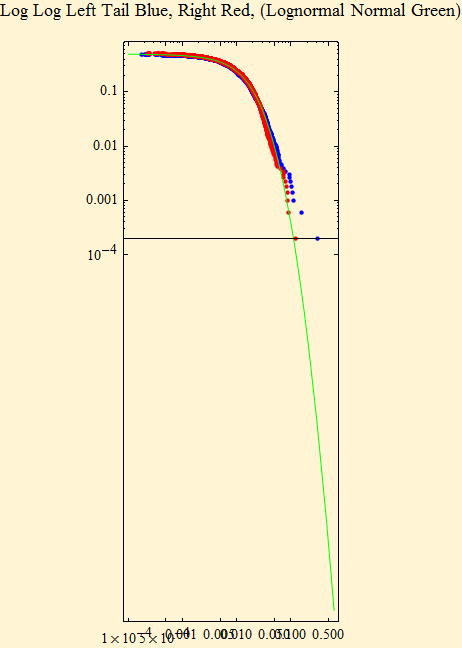
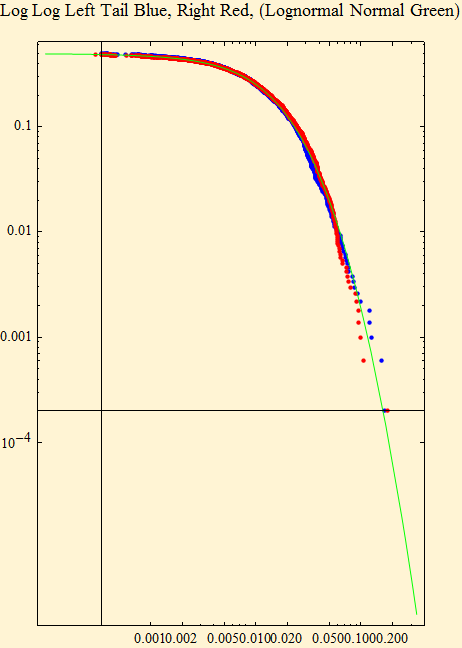
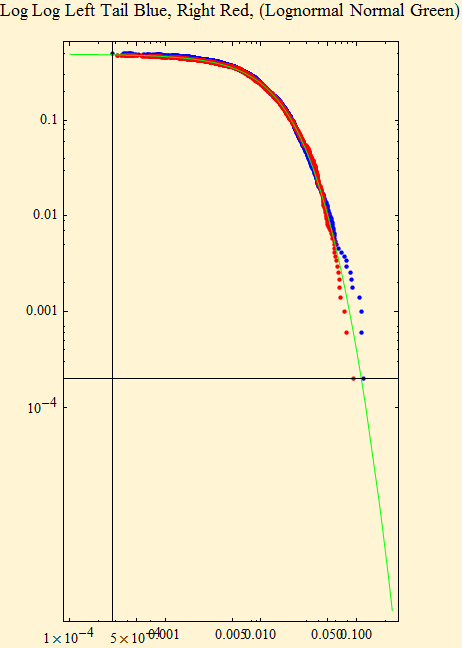
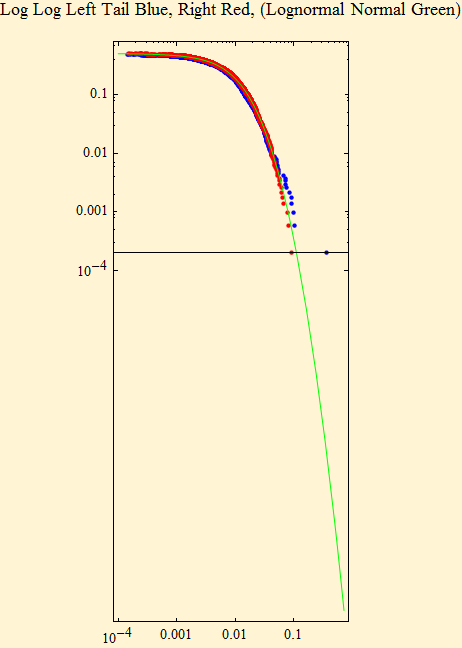
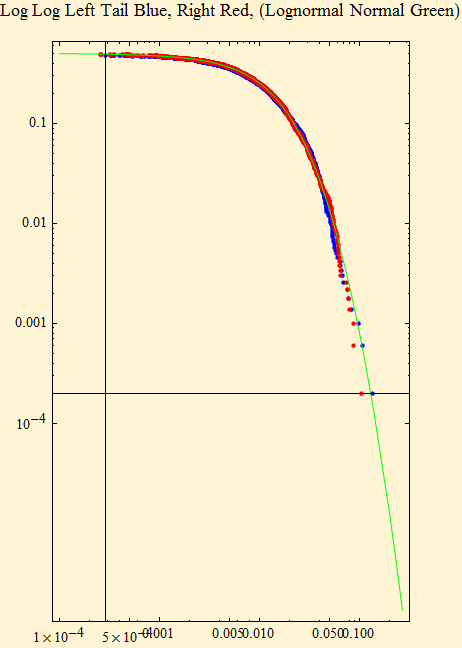
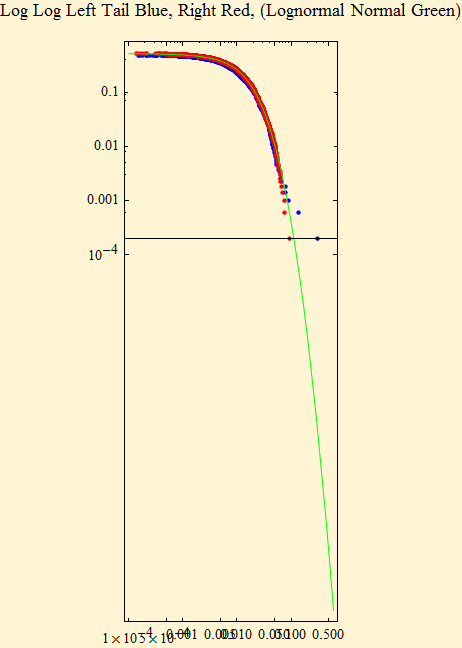
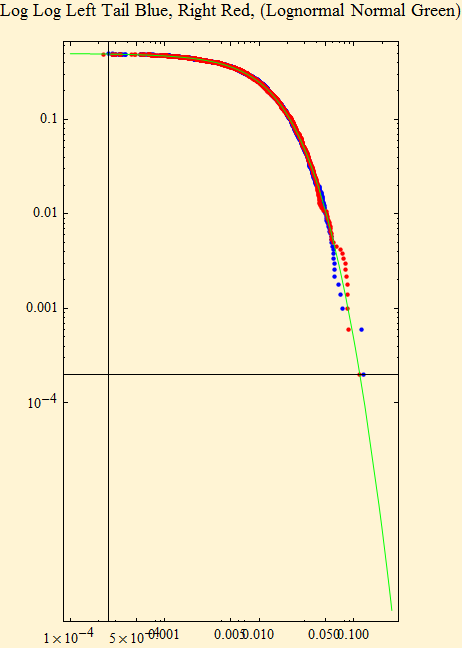
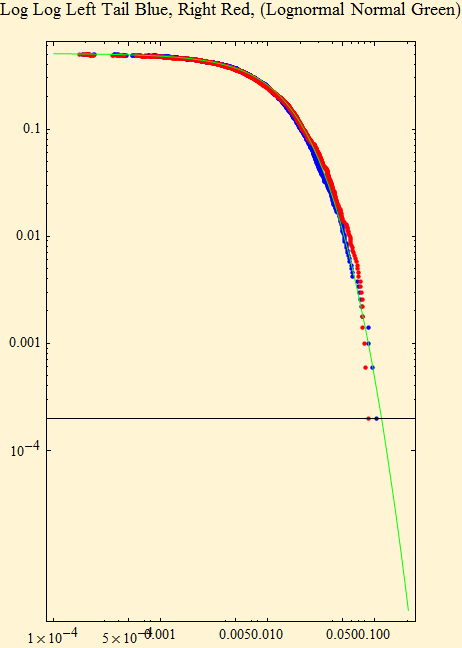
The graphics below show the lognormal-normal mixture (LNN) fits to the logarithmic returns to the stocks in the Dow Jones Industrial Average for ten years of data. The fits are shown for the empirical density data points and the LNN distribution function in green, with the same configuration we have been using for stable distributions. The ticker symbol, start date, and end date for the data along with the starting and ending price for the time-series of the fit are shown for each plot. In the log-log plot every tail point in the ten-year data set is represented.
![]()
![]()
![]()
![]()
![]()
![]()
![]()
![]()
![]()
![]()
![]()
![]()
![]()
![]()
![]()
![]()
![]()
![]()
![]()
![]()
![]()
![]()
![]()
![]()
![]()
![]()
![]()
![]()
![]()
![]()
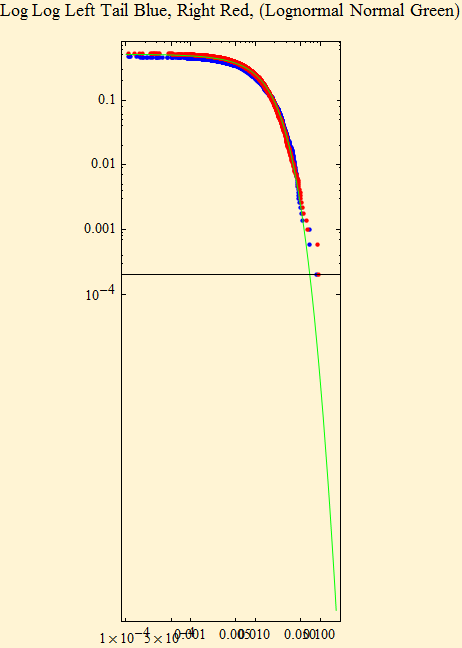
The LNN fit parameters are shown for each ticker.
| Ticker | γ | σ | δ |
| AA | 0.0143776 | 0.379748 | 0.0000811193 |
| AIG | 0.0105503 | 0.546865 | -0.000128683 |
| AXP | 0.012167 | 0.526956 | 0.0000873189 |
| BA | 0.0122332 | 0.382974 | 0.000273366 |
| BAC | 0.0100915 | 0.592507 | 0.00025833 |
| C | 0.0114741 | 0.570884 | -0.000146885 |
| CAT | 0.012411 | 0.404011 | 0.000526981 |
| CVX | 0.00997108 | 0.28126 | 0.000473874 |
| DD | 0.0105449 | 0.452357 | -0.0000605811 |
| DIS | 0.0121173 | 0.46576 | -0.000164497 |
| GE | 0.0100534 | 0.500971 | -0.000209129 |
| GM | 0.0143105 | 0.411722 | -0.00035456 |
| HD | 0.0127974 | 0.486911 | -0.000185893 |
| HPQ | 0.0145468 | 0.531354 | 0.000371338 |
| IBM | 0.0105728 | 0.501313 | 0.000356852 |
| INTC | 0.0168842 | 0.393565 | 0.000139461 |
| JNJ | 0.00771572 | 0.507225 | 0.000296962 |
| JPM | 0.0119605 | 0.605455 | 0.0000658679 |
| KO | 0.00830957 | 0.540472 | -0.0000826663 |
| MCD | 0.0106858 | 0.395635 | 0.000297342 |
| MMM | 0.00884088 | 0.47815 | 0.000326877 |
| MRK | 0.0105157 | 0.451994 | -0.000104989 |
| MSFT | 0.0115218 | 0.561703 | -0.000107142 |
| PFE | 0.0107934 | 0.443709 | -0.000206686 |
| PG | 0.00794587 | 0.558387 | 0.000232795 |
| T | 0.0111047 | 0.490385 | 0.000182797 |
| UTX | 0.0107953 | 0.441281 | 0.000506665 |
| VZ | 0.0108119 | 0.455917 | -0.0000204924 |
| WMT | 0.010947 | 0.447005 | 0.000314356 |
| XOM | 0.0101004 | 0.258761 | 0.0004501 |
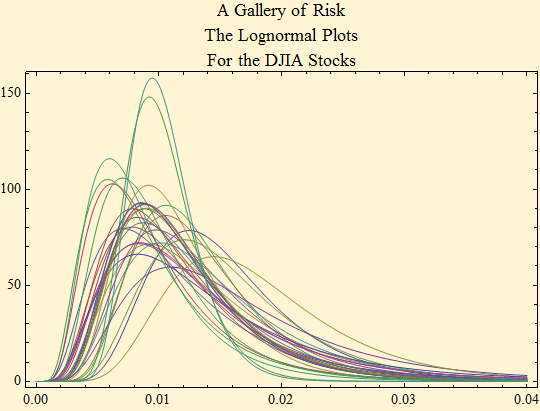
The lognormal density plots of the {log(γ), σ} are shown for each stock. This presents a two dimensional visualization of risk.

© Copyright 2008 mathestate Wed 18 Jun 2008
