Presidential Prediction Markets
We have put up a series of pages using stable analysis of prediction markets. The Iowa and Intrade markets use real money. The Wall Street Journal and Rasmussen markets allow people to trade like they are using money, but do not require any payment. The Iowa market has limited accounts ($500) and special permission from the SEC to operate. Intrade is based in Ireland. Links to these pages are given below.
Iowa Electronic Market Data
Wall Street Journal Data
Intrade Data
Rasmussen Markets Data
When we have analyzed these prices, we have made the assumption that they should behave fundamentally like other financial markets and that differences of log prices should have a heavy tailed distribution. This seems to be true but there are some differences in the shapes of the logarithmic returns that are difficult to explain. We show these using the intrade data for the most recent 180 days.
| α | β | γ | δ | |
| Obama Closing | 1.34382 | 0.251771 | 0.0110979 | 0.00479108 |
| McCain Closing | 1.35626 | -0.0702056 | 0.0197488 | -0.00511718 |
The two price series at the end of the campaign show similar values for the stable shape parameter, α. To show this graphically stable fits of the density are shown to the two data histograms.

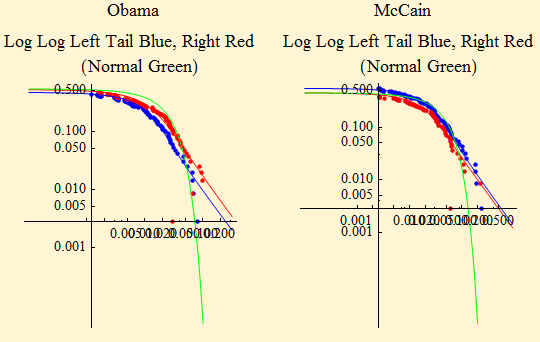
The histograms show the Obama data to be more concentrated in the center as would be expected by the lower α in the fit. Are these data truly stable? The fits below show the tail behavior, using a special log distribution plot.

The Obama data does not look like it belongs to a stable distribution. The McCain data appears more likely stable and the fit has an α closer to that seen in real financial markets. We have no idea why Obama buyers should behave differently than McCain buyers, but this seems consistent right now across all the markets we are following. In all the markets, volume has been increasing as we approach the election and we may see the shape of the data change.
We are experimenting with another approach to analyze the data. In the series below we take the log[ratio] of the Obama/McCain prices and look at the differences. Using a ratio of prices overcomes one problem in the futures prices--they have an upper limit, 100. The ratio is more like an actual price with a range, (0, ∞). The series of the logarithm of the ratio is shown below. A result of zero, Log[1] implies a tie, a positive result implies an Obama win; a negative result implies a McCain win.
The plot of this data set shows Obama firmly in the lead until recently with the ratio crashing.
![Graphics:Log[Obama/McCain]](HTMLFiles/PresidentialPrediction_3.gif)
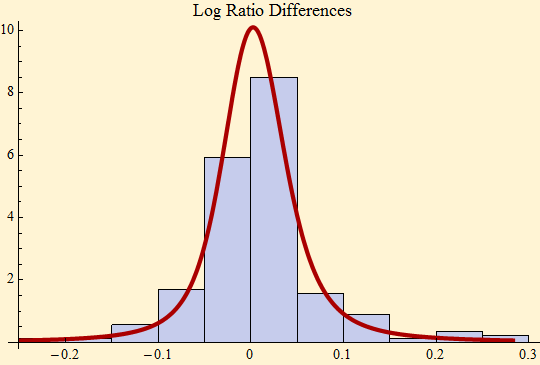
We look at the stable fit to the differences of the Log[Obama/McCain] and find the stable fit to be appropriate.
| α | 1.39173 |
| β | 0.116037 |
| γ | 0.028724 |
| δ | 0.00808581 |

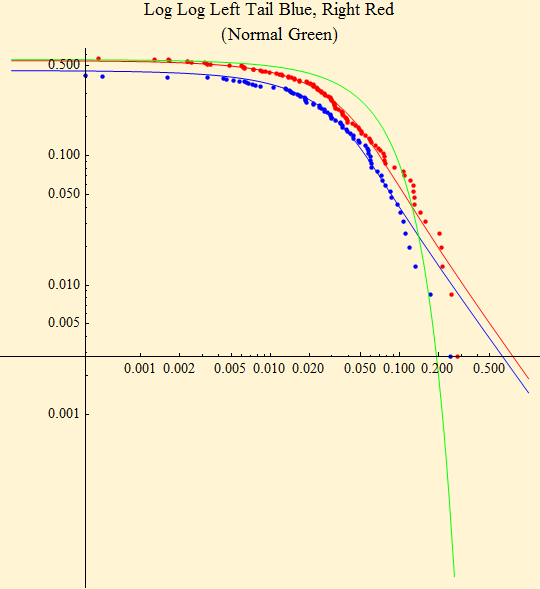
The fit of the log ratio differences looks more clearly stable on the tails.

We now project this data set to election day. The probability of a scaled outcome less than zero is a McCain win and the probability of a scaled outcome greater than zero is an Obama win. We take the last ratio and see how much change is needed to bring the result to zero.
Data scaled by 1 days. Last data point on Mon 3 Nov 2008.
Probability of McCain win 0.000561848
Probability of Obama win 0.999438
The calculation below, removes the trend (expectation of log return) in the data by setting the location parameter, δ, to zero.
Data scaled by 1 days. Last data point on Mon 3 Nov 2008.
Probability of McCain win 0.000565053
Probability of Obama win 0.999435

© Copyright 2008 mathestate Mon 3 Nov 2008
